These images were acquired using MIC instruments. For suggestions, comments and questions, please contact Sara Maynard.
Rules for Picture of the Month:
1. Image must be submitted by the last day of the month. Image can be from any time and does not have to be acquired during the same month. The announcement of the monthly prize winners will be during the first week of the following month.
2. Winners receive a free MIC t-shirt and their image displayed on the MIC website.
3. Entries will be judged on the following: Technical Skill, Visual Appearance, and Quality of Data.
4. The images are voted on by the MIC staff and one winner is chosen for the month.
5. Each person is limited to 4 monthly wins per calendar year. If you win more than once you may give your t-shirt to a fellow lab mate.
6. If your image does not win for the month you enter, your image will be re-submitted for you in the subsequent 3 months.
7. By entering our Picture of the Month contest, you are agreeing to assign the image copyrights to our Center to be used on our website. Credit will always be given to the author of the image.

January 2026
This is a whole mount Molino cave morph, transgenic for hypocretin circuits, stained with anti-GFP and anti-tERK. The image was acquired on the Nikon AXR laser scanning confocal microscope with the 20X immersion lens. Sample and image courtesy of Ms. Aakriti Rastogi from Dr. Alex Keene’s Lab, Department of Biology.


December 2025
Freeze caste Lunar regolith monolith filled by the Na2SiO3 solution to improve the mechanical properties. Taken with FEI Quanta 600 SEM at 10000X. Sample and image courtesy of SK Hossain, member of Dr. Jeff Bullard’s lab, Civil Engineering, TAMU.


November 2025

Winner: Yang Hyun Auh
“MXene nanosheet and composite membrane”
These images show Ti₃C₂Tₓ MXene nanosheets and composite membranes complexed with polymer. The images were taken using SEM (JEOL JSM-7500F and Tescan FERA-3 Model GMH Focused Ion Beam Microscope, respectively) and TEM (Titan Themis 300 S/TEM). The images submitted by Yang Hyun Auh from Dr. Jodie L. Lutkenhaus’s lab are courtesy of Natalie N. Neal, Dr. Kailash Arole, Dr. Yordanos Bisrat and Dr. Sisi Xiang.
Cross-sectional TEM measurement was performed by preparing film sections cut from each LbL-coated substrate using focused ion beam (FIB) milling with a Tescan FERA-3 Model GMH FIB-SEM system. A Ga⁺ ion beam was used to mill the samples after depositing protective Pt layer over the region of interest.
SEM Acquisition Info
Instruments: JEOL JSM-7500F, Tescan FERA-3 FIB-SEM
Sample prep: 5 nm sputter coating on Si substrates
FIB milling conditions: 30 kV Ga⁺ beam, 12 nA–50 pA
Purpose: top-view imaging and lamella fabrication
Instrument: Titan Themis 300 (300 kV, aberration-corrected)
Mode: S/TEM with Super-X EDS
Camera length: 91 mm (STEM)
Sample: FIB-milled lamella with Pt protective layer
Purpose: cross-sectional imaging
October 2025
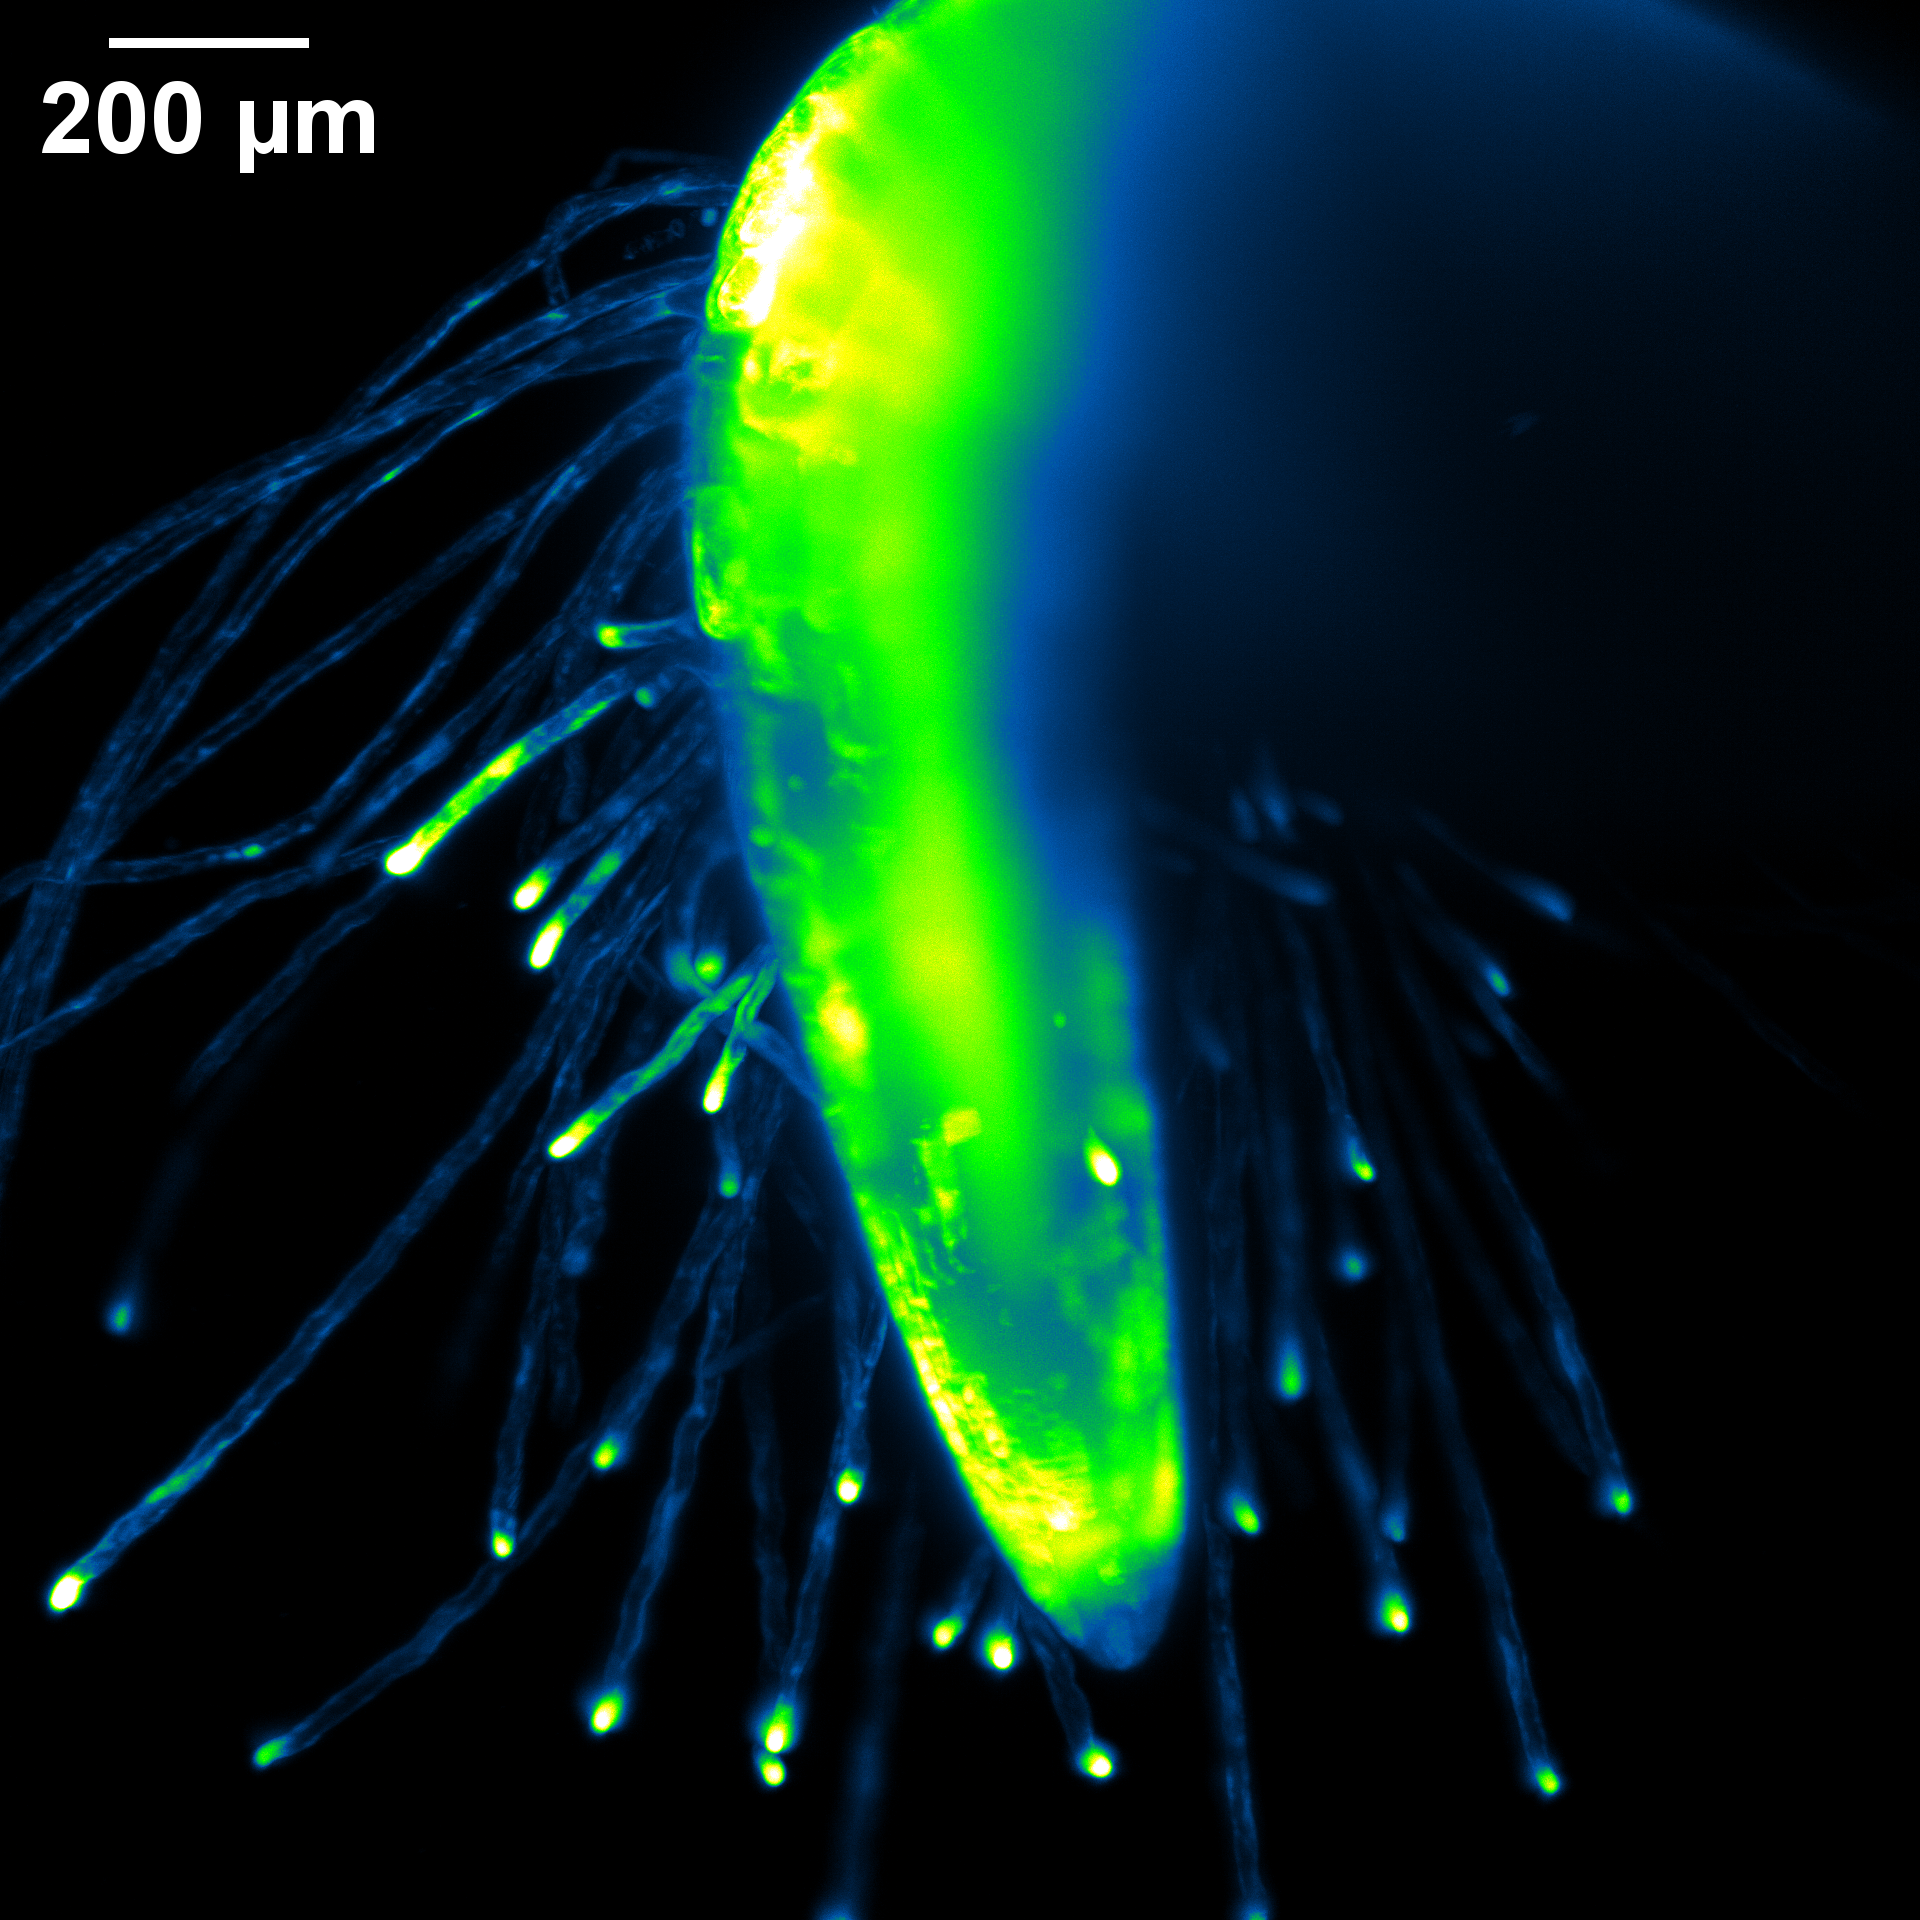
The root of a 2-day-old Arabidopsis seedling expressing fluorescent cytosolic calcium sensor GCaMP. The sample was grown in FEP tubing and imaged on the Zeiss Light Sheet with the 20X immersion lens. Sample courtesy of Kaitlin Hill and Cerrina Rodriguez. Image Courtesy of Kaitlin Hill (Griffing Lab, Biology) and Holly Gibbs.

September 2025
unit=mm. Dimensions=2.56×2.56mm. 5x magnification. Zeiss Lightsheet.
The vasculature of a mouse spinal cord perfused with fluorescently-tagged lectin Wheat Germ Agglutinin. This is a maximum intensity projection of the 3D image (color-coded based on depth) taken with the Zeiss Lightsheet. Sample courtesy of Mia Pacheco. Image courtesy of Andrew Buxton (McCreedy Lab, Department of Biology). Sept. 2025.

March 2024
This image is of slip bands observed in nanoindentation taken on the Leica SP8 Confocal at 150x with Laser Differential Imaging Contrast. The image submitted by Daniel Lewis in Dr. Brady Butler’s Materials Science lab is courtesy of Dr. George Pharr through the HTMDEC program.
November 2023
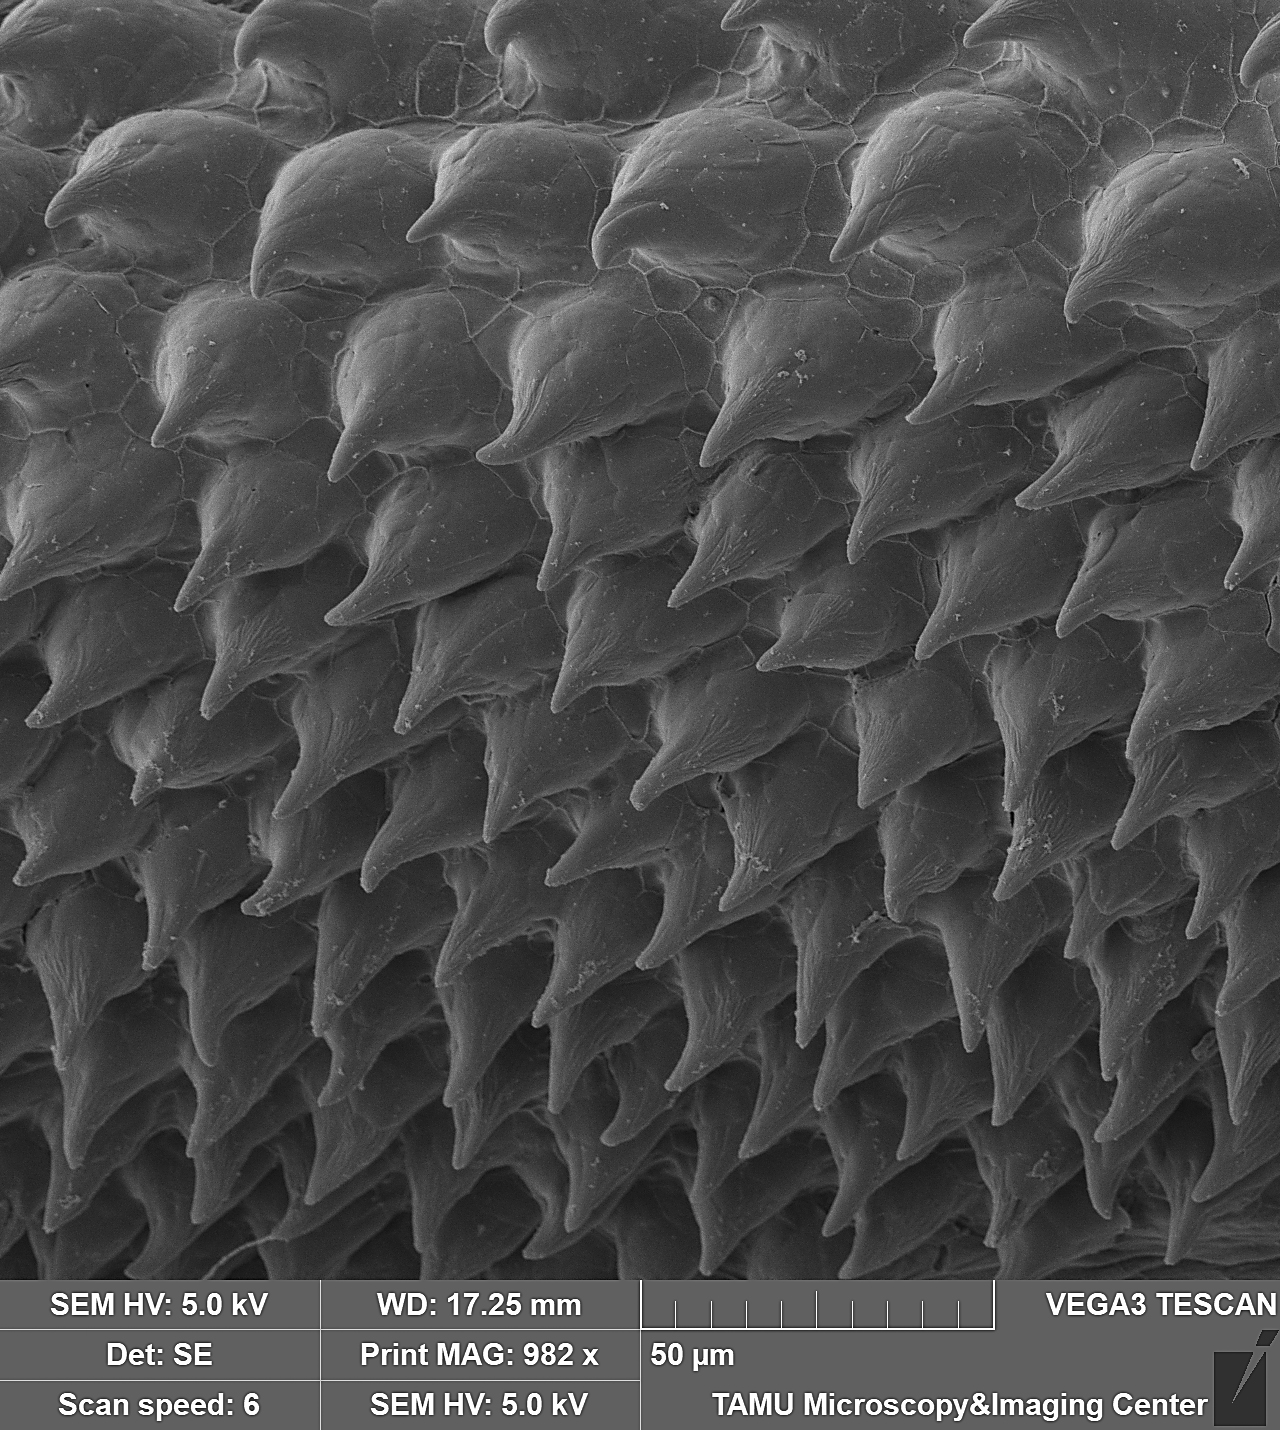
This image is of a pectoral fin of an undescribed loach, Petruichthys sp., from Myanmar. The image was taken on the Tescan Vega SEM. This is high magnification SEM of turbercles (conical, multi-cellular aggregations of keratin produced by epidermal cells) on the surface of the pectoral fin in a mature male specimen of Petruichthys sp., an undescribed species of loach from Myanmar (commonly known as the “Rosy Loach” in the aquarium hobby). This horny (keratinous) patch of tubercles is one of many male-specific (sexually dimorphic) traits of this small-bodied species of freshwater fish. Each individual tubercle is ~20μm tall and the SEM shows ~80 organized into a series of regular rows. The image was taken and submitted by Dr. Kevin W. Conway in the department of Ecology and Conservation Biology.
October 2023
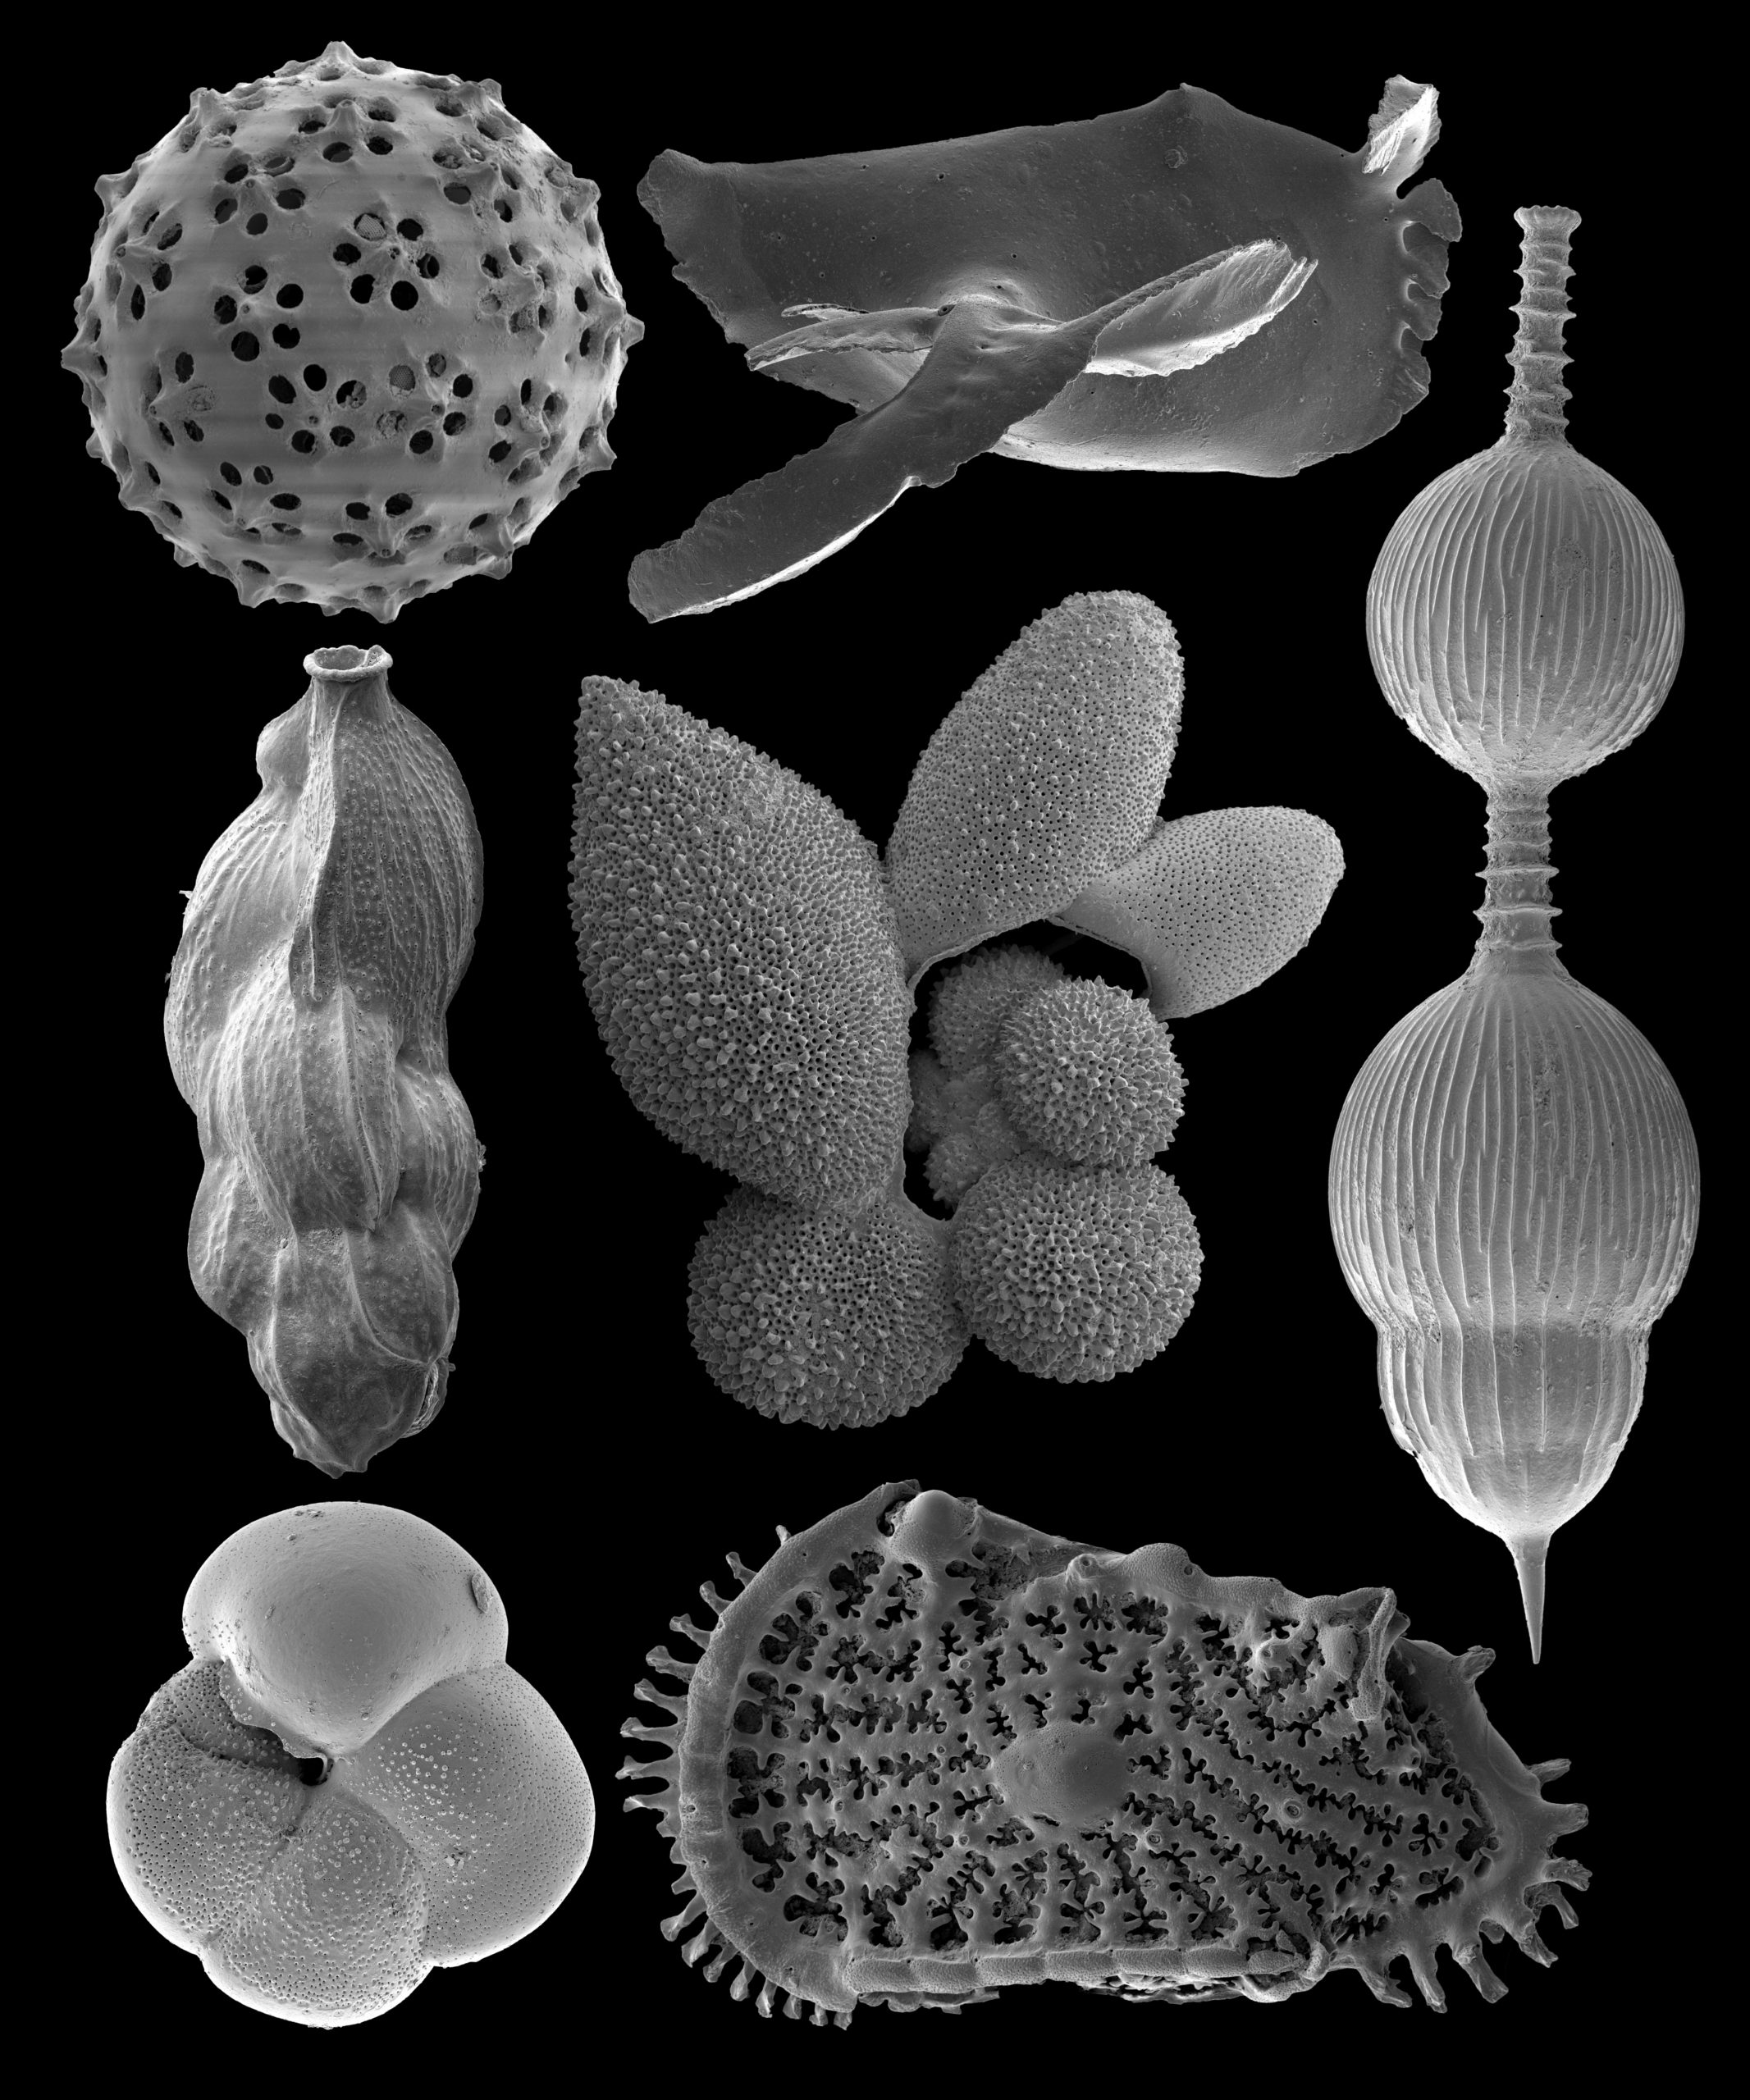
This image is of late Pleistocene deep sea microfossils taken on the FEI Quanta 600 SEM at 300x magnification, 5kV, and 30mm working distance. Images were taken by Dr. Carlos Alvarez Zarikian of the International Ocean Discovery Program.

September 2023
This image is a toxic mirror image RNA recruited NONO protein to the nucleolus. HeLa cells were transfected with 200nM toxic mirror image RNA (Red) for 2 hours and stained with anti-NONO primary antibody and Cy3 labeled secondary antibody (Green). Nucleus was stained with Hoechst (Blue). White arrows indicate the nucleolus colocalization of the mirror image RNA and NONO. The image was taken on the Leica SP8 confocal with 40X water immersion objective courtesy of Chen-Hsu Yu in Jonathan Sczepanski’s lab (Chemistry department).
May 2022
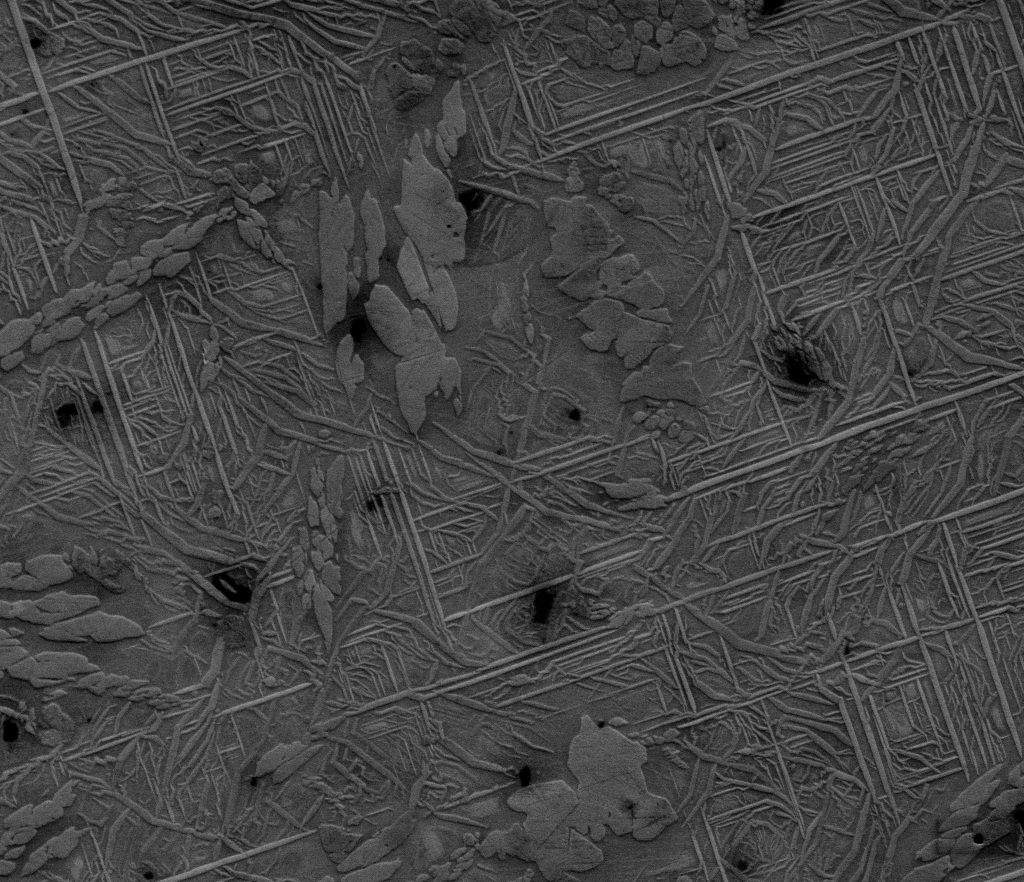
This image is a CuZnAl shape memory alloy taken on the FEI Quanta 600 SEM at 1000x as a secondary electron image at 10kV. This image is courtesy of Eli Norris of Dr. Ibrahim Karaman’s lab (MSEN). The sample is courtesy of William Trehern.
April 2022
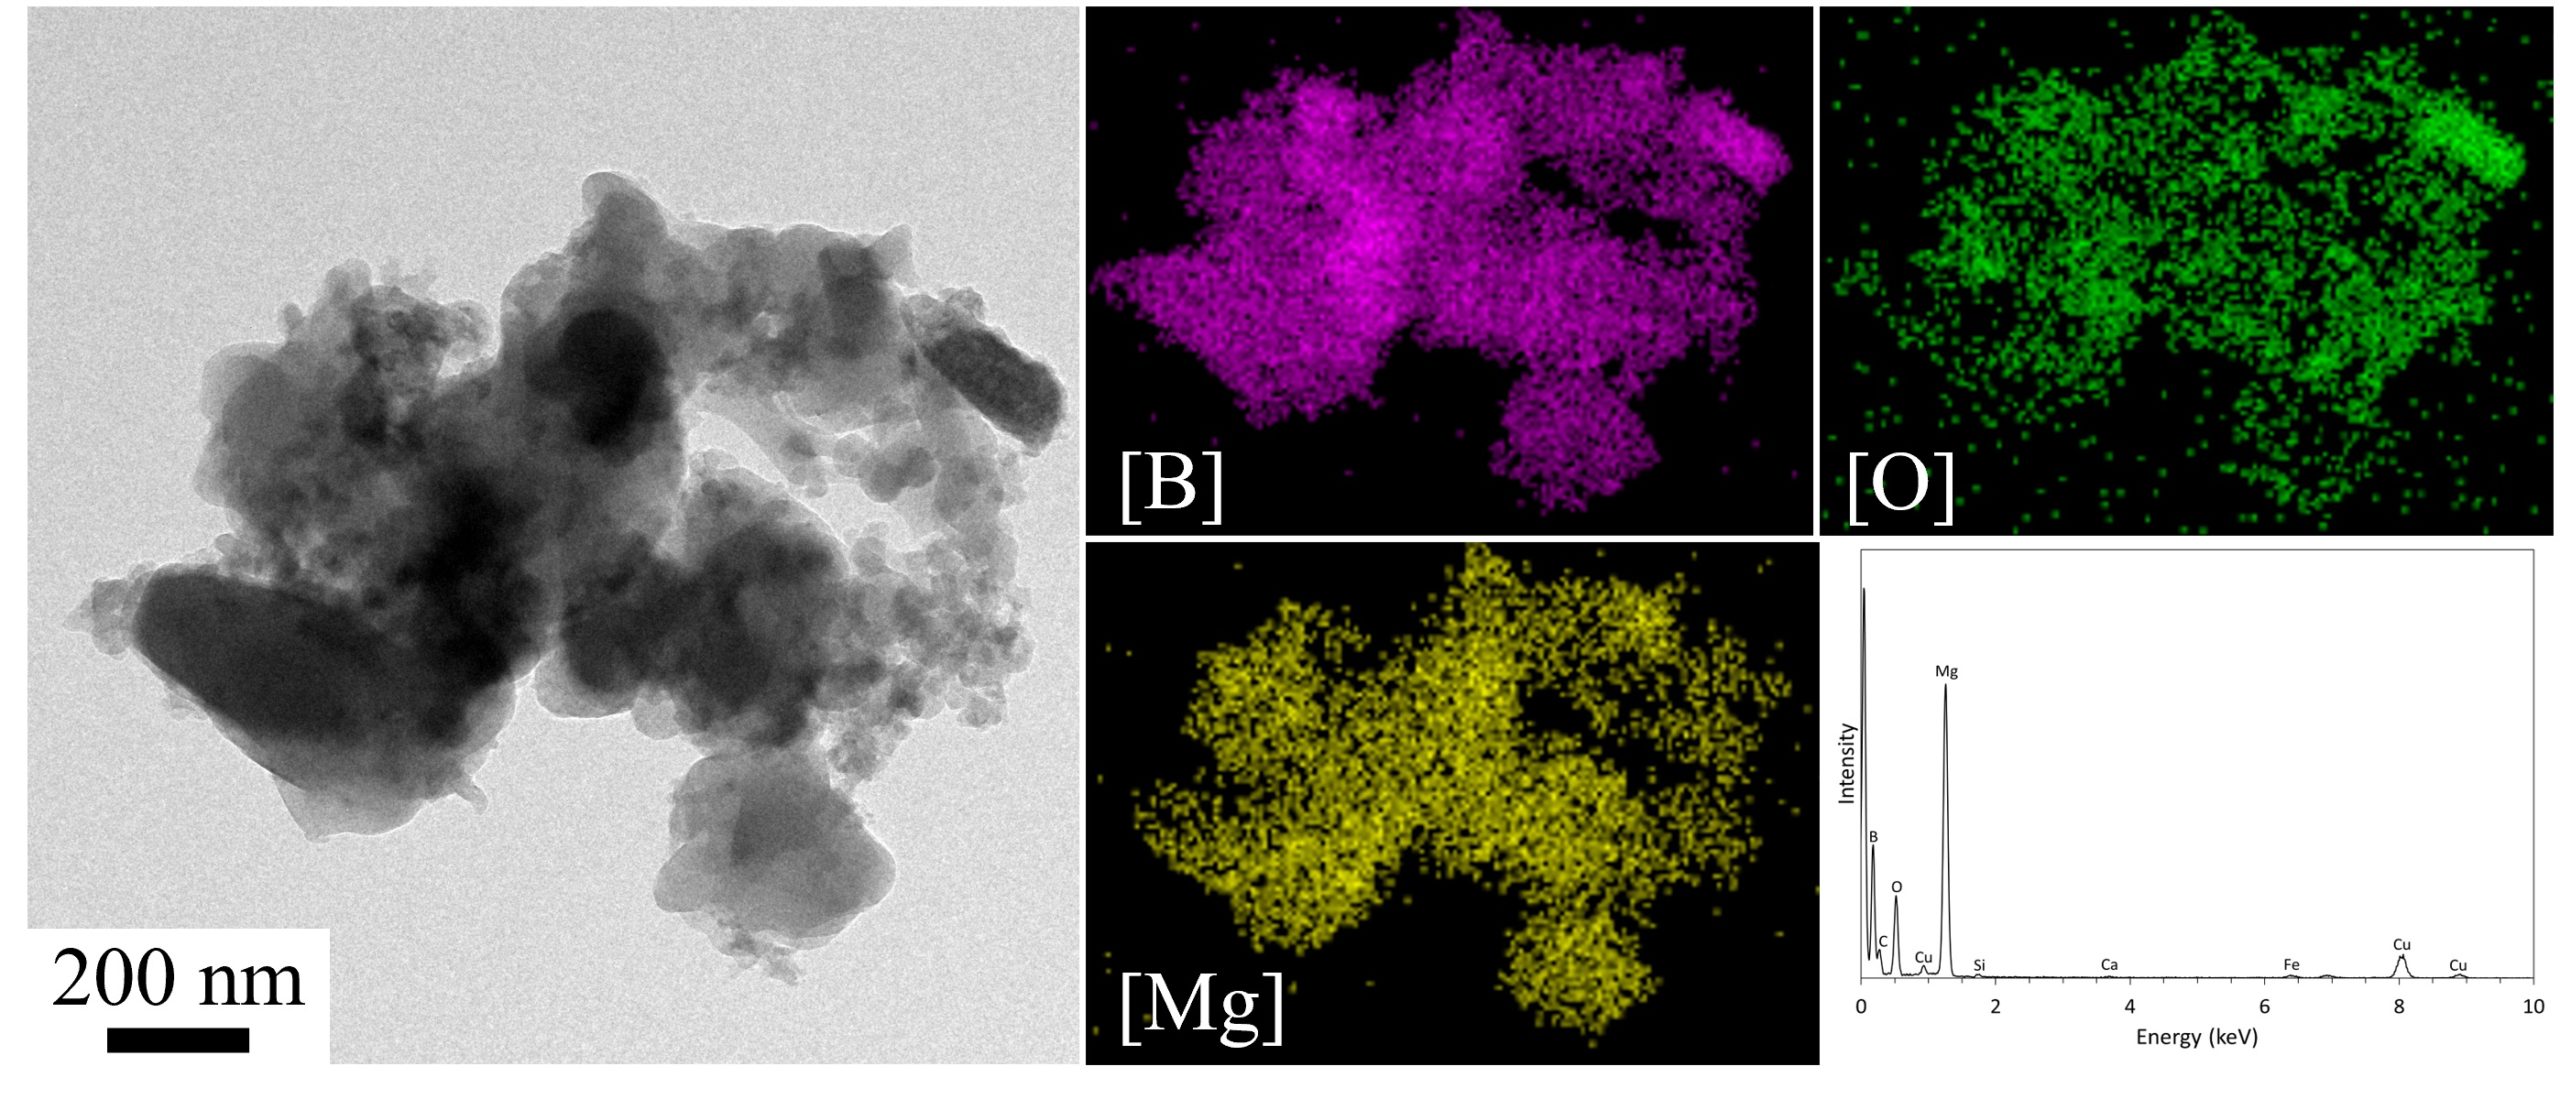
This image is a TEM image, EDS maps, and deconvoluted EDS atomic analysis of a magnesium-coated nano-boron aggregate for energetic rocket propellant applications. This image was taken at 15kX magnification and is courtesy of Dr. Chris Thomas (Mechanical Engineering).
September 2021
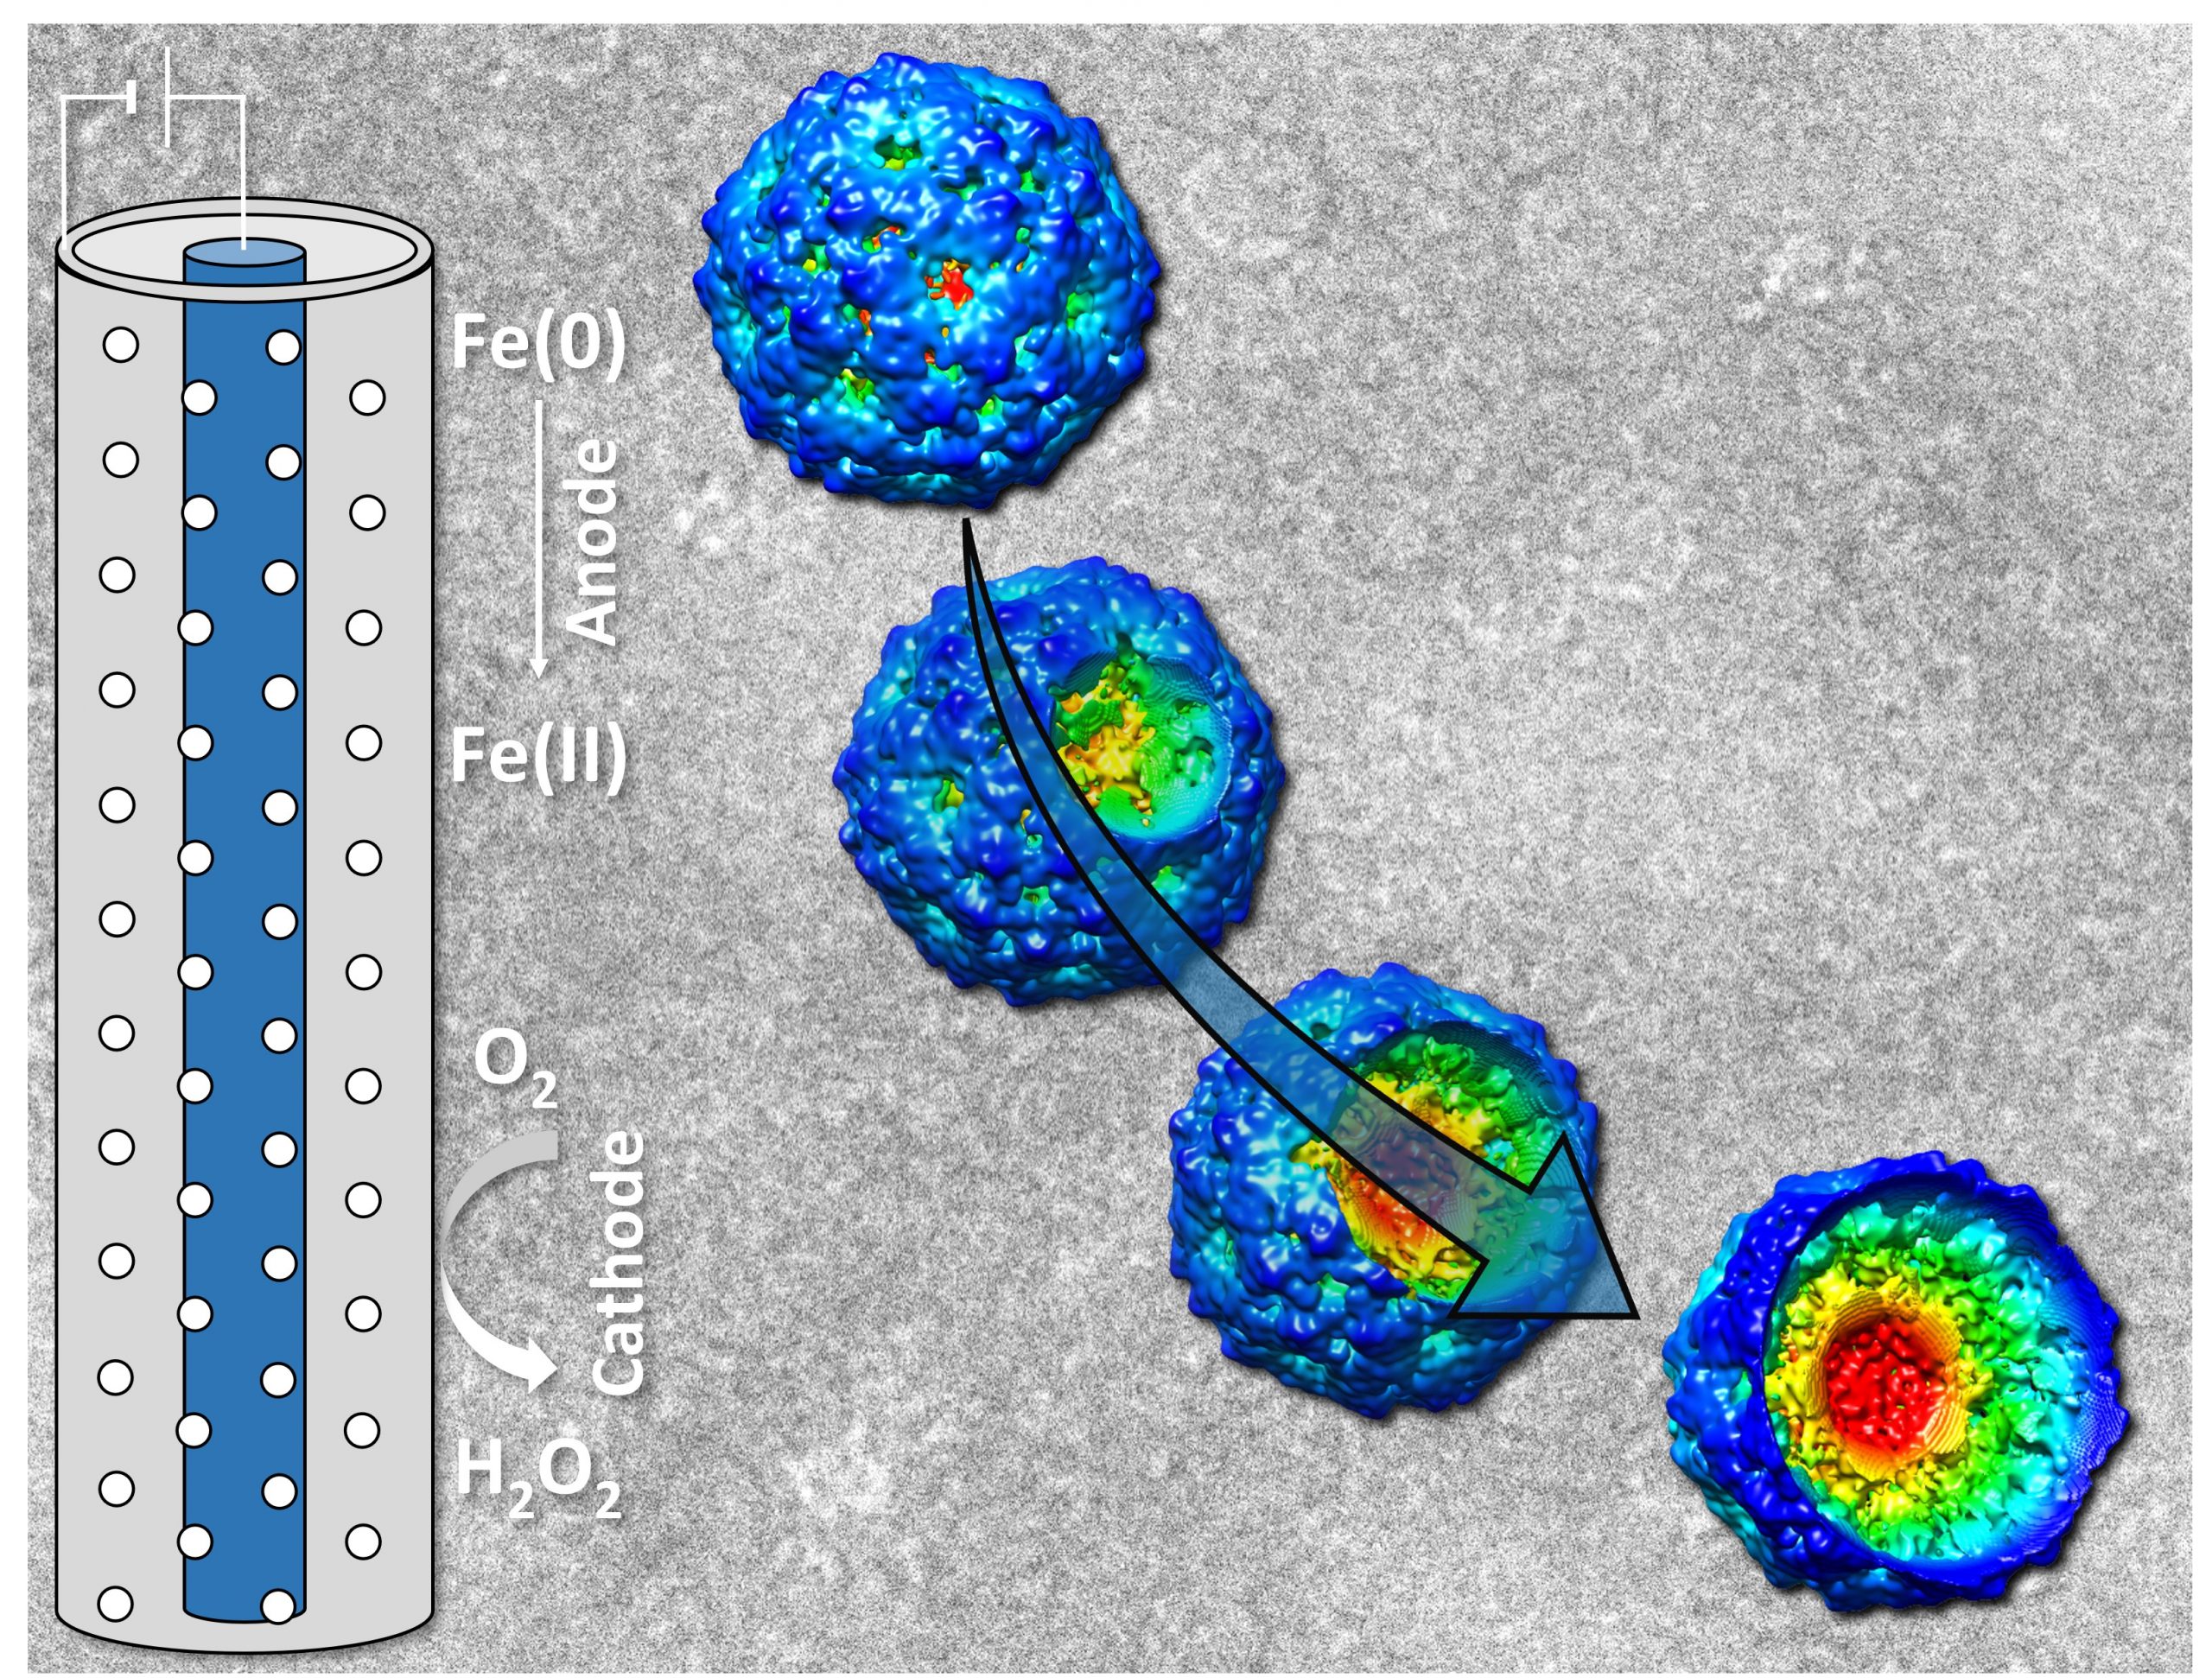
Image is a graphical abstract to illustrate collaborate work mentioned below.
Research description: Virus inactivation using iron electrocoagulation
Major participants: Kyungho Kim, and Dr. Shankar Chellam at Zachry Department of Civil and Environmental Engineering, Texas A&M University
Dr. Anindito Sen at Microscopy and Imaging Center, Texas A&M University
Dr. Jothikumar Narayanan at Centers for Disease Control and Prevention, National Center for Emerging and Zoonotic Infectious Diseases
Relevant publications:
K. Kim, N. Jothikumar, A. Sen, and S. Chellam, Virus Removal and Inactivation Mechanisms during Iron Electrocoagulation: Capsid and Genome Damages and Electro-Fenton Reactions, Environmental Science and Technology, (2021) https://doi.org/10.1021/acs.est.0c04438
K. Kim, N. Jothikumar, A. Sen, J. L. Murphy and S. Chellam, Removal and Inactivation of an Enveloped Virus Surrogate by Iron Conventional Coagulation and Electrocoagulation, Environmental Science and Technology, 55 (2021) 2674-2683
July 2021
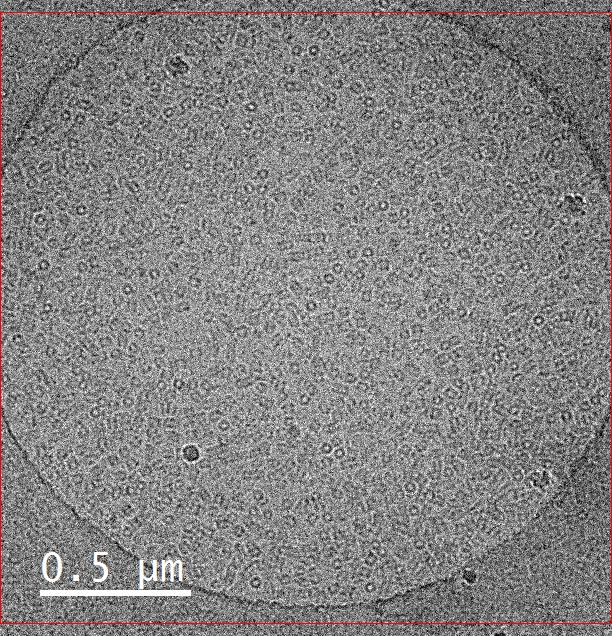
This image is a sample of hemocyanin (5mg/ml) taken on the FEI Tecnai G2 F20 Cryo FE-TEM at an accelerating voltage of 200kV with a defocus of 2 μm and a spot size of 7. The K2 camera with dose fractioned in counted mode on a holey carbon grid. The sample and image were courtesy of Omkar Shinde (Dr. Pingwei Li, Biochemistry and Biophysics).
March 2021
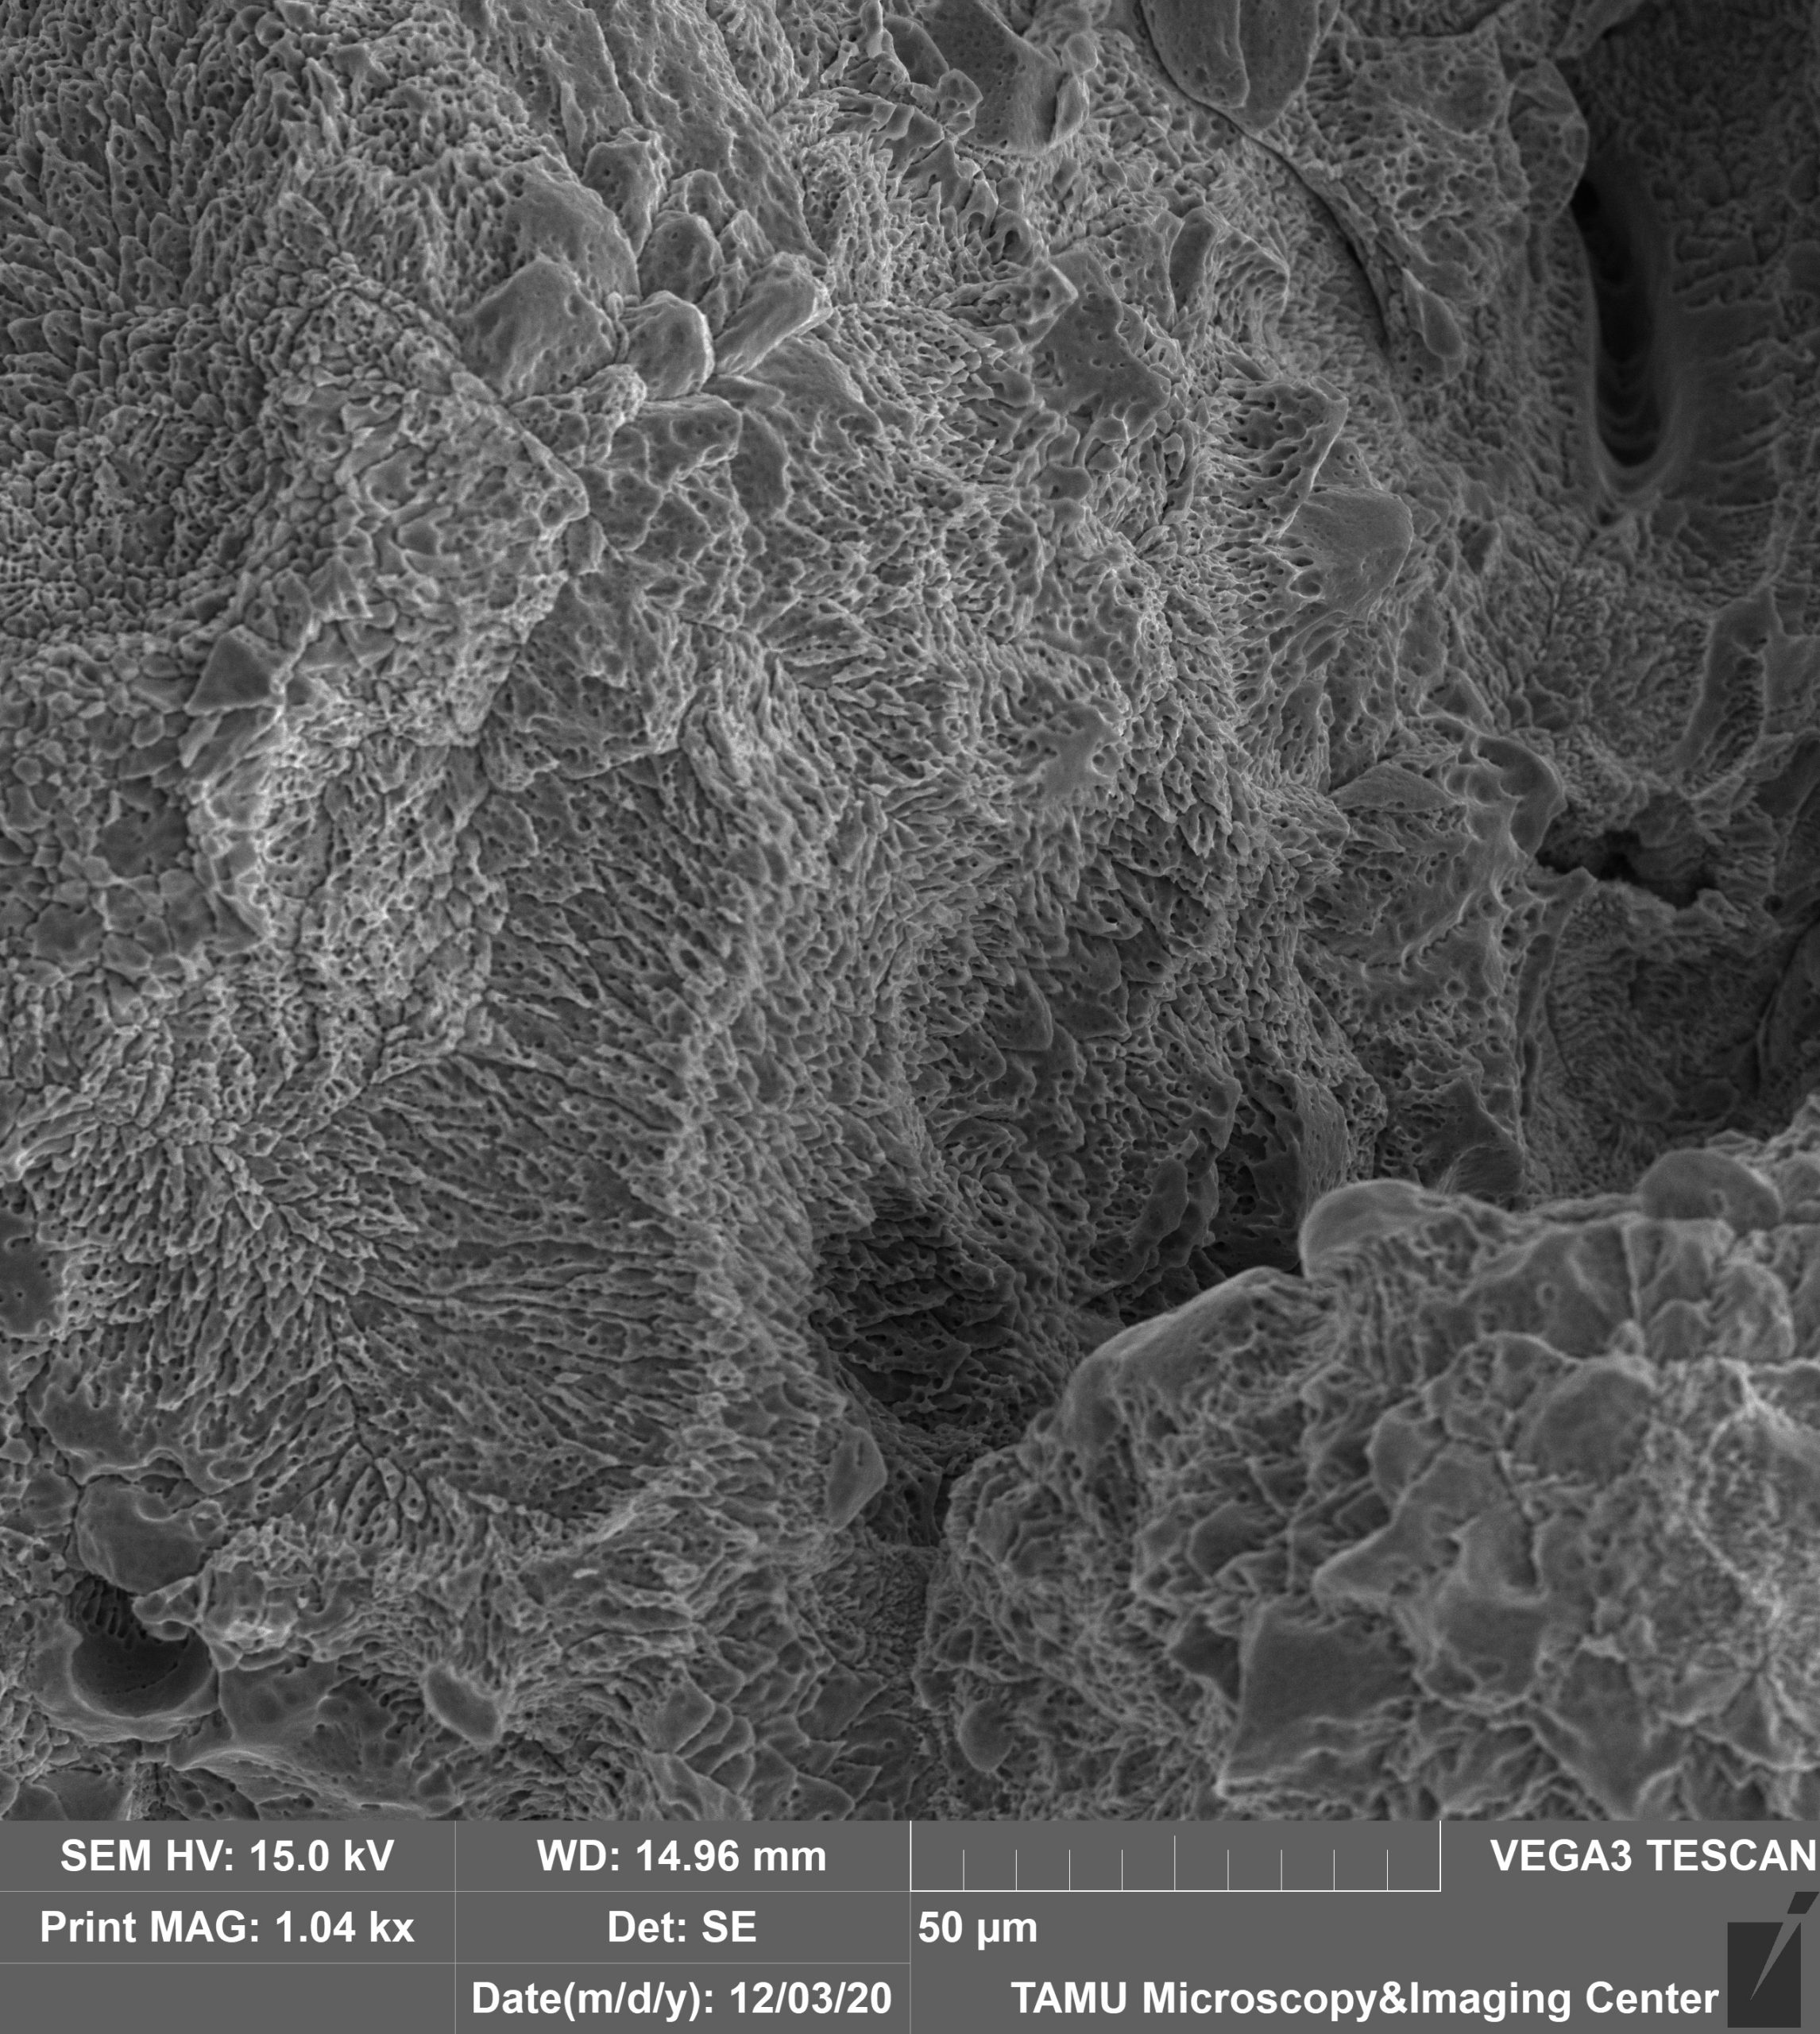
This image is an underside surface of an overhang from a 3D-printed NiTi part that is then chemically etched by aqueous sodium fluoride for 1 hour at 40C. This image was taken on the Tescan Vega at 1000x with secondary electrons and 15mm working distance. This image is courtesy of Jacob Mingear (Dr. Darren Hartl, MSEN), and the sample is courtesy of Bing Zhang (Dr. Alaa Elwany, ISEN).
February 2021
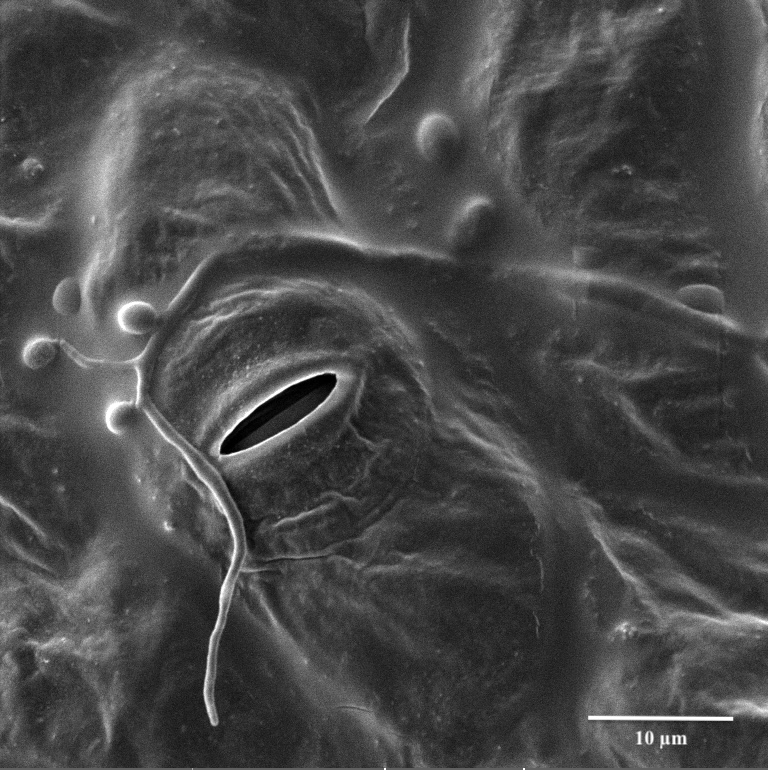
We are looking at the entomopathogenic fungus Beauveria bassiana entering its reproductive stage on a cotton leaf (micro cycle conidiation). The image was viewed on the Tescan Vega at 3700x magnification with a StageTilt of 9.999937. This image is courtesy of Dr. Stan Vitha (MIC) and the sample was courtesy of Cesar Valencia (Dr. Gregory Sword, Entomology).
January 2021
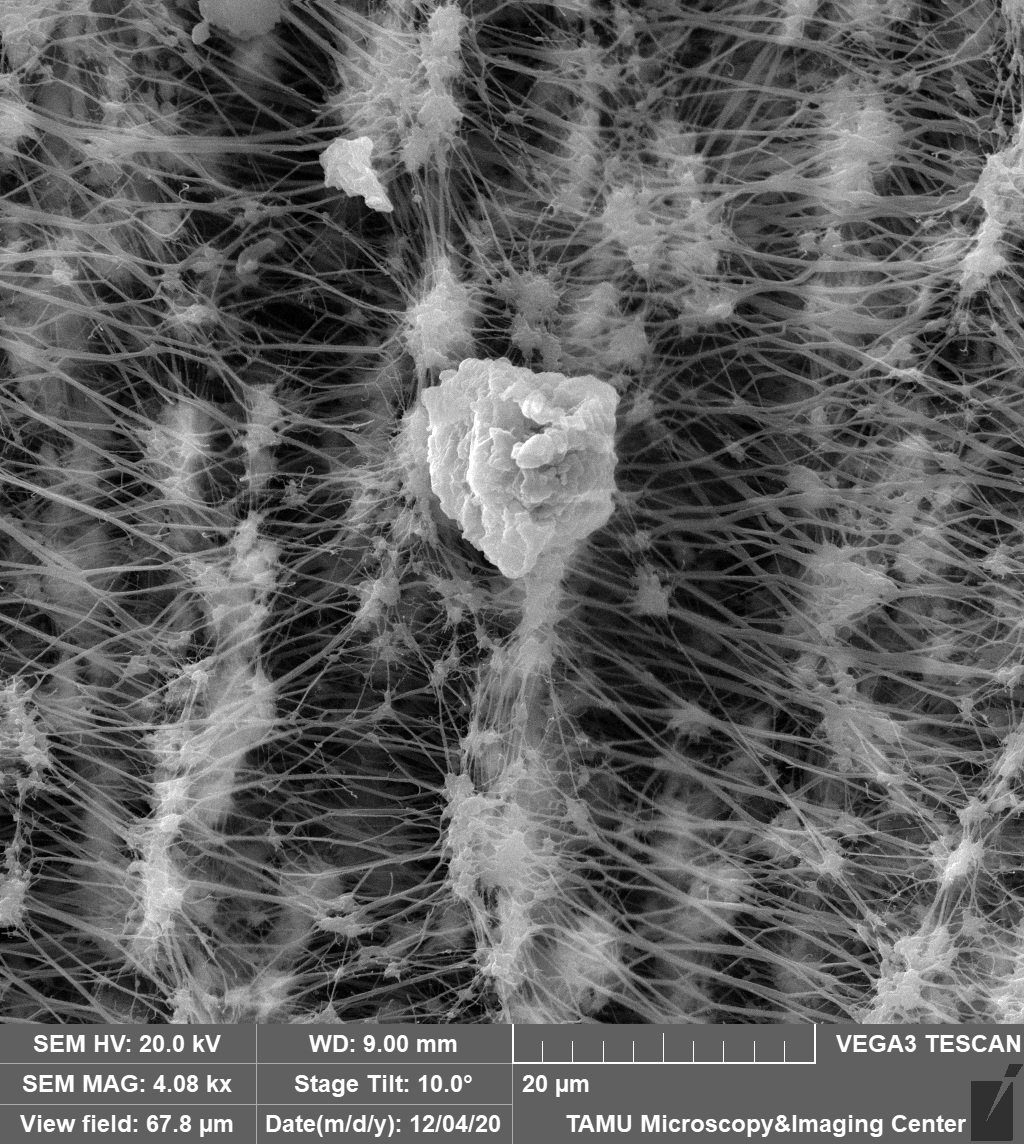
This image depicts a dust sample on an air filter. This sample was taken by a PM 2.5 air sampler with surprising intricacy of the filter membrane. The image was viewed on the Tescan Vega at a 4.08kx magnification and field of view at 67.8 microns. The image was courtesy of Dr. Stanislav Vitha (MIC) and the sample was courtesy of Robert Credeur (Dr. Sergio Capareda, BAEN).
December 2020
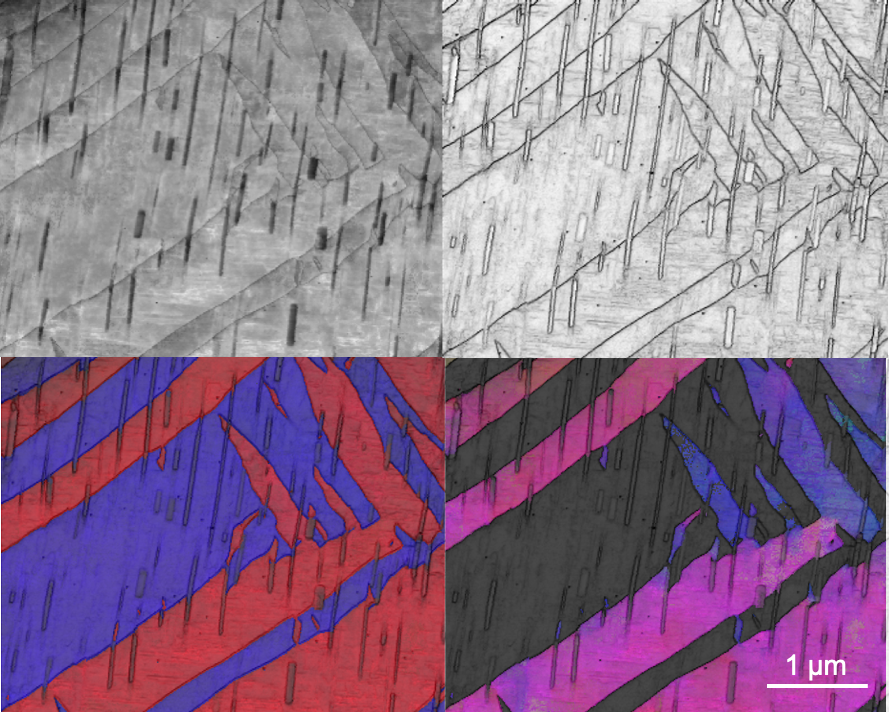
This is the Mg twin-precipitate interaction using ASTAR orientation mapping from multiple methods. It is nano-scale orientation mapping with the ASTAR instrument on the FEI Tecnai G2 F20 ST FE-TEM Materials. The image and sample are courtesy of Dexin Zhao (Kelvin Xie, MSEN).

November
These are scanning electron micrographs of various sections (increasing magnification from left to right) of the Vein-on-a-Chip after deep vein thrombosis formation. The thrombus is rich in fibrin and red blood cells, devoid of platelets and contain leukocytes (marked). Scale bars from left to right, 100 µm, 50 µm, 10 µm and 5 µm. These images were taken at SEM HV: 5kV, SEM Mag, (left to right): 0.71 kx, 1.46 kx, 2.10 kx, 3.74 kx. Image courtesy of Dr. Stanislav Vitha (MIC) and sample courtesy of Navaneeth Pandian (Dr. Abhishek Jain, BMEN).
October
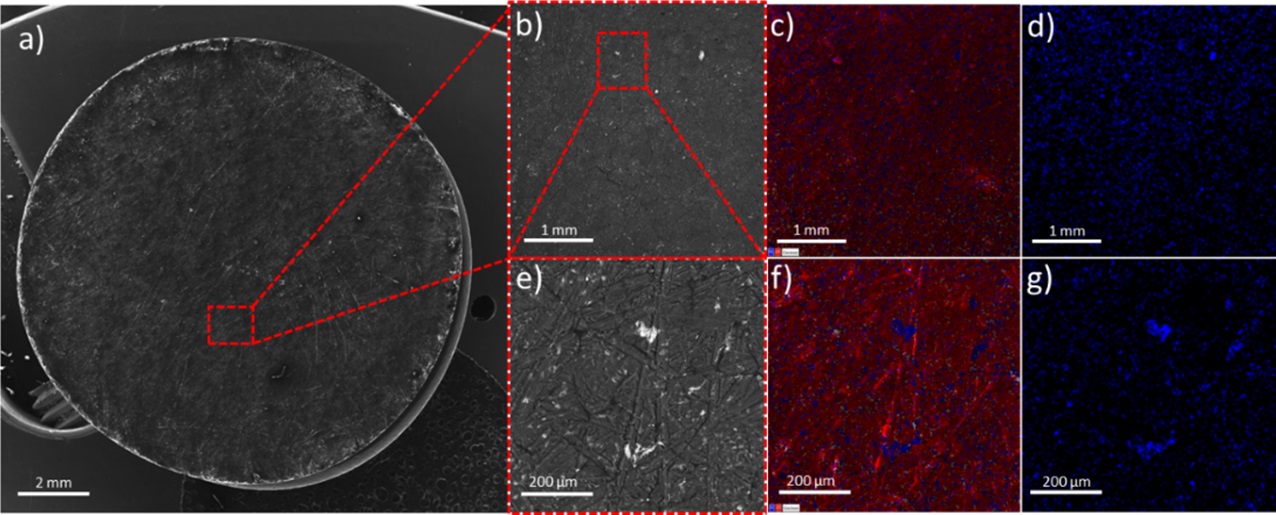
This image is of Pressed Rocket Propellant Oxidizer Loaded with Catalytic micro-TiO2 Particles. This was taken on the Tescan Vega SEM with at the following: a)Plain, wide-view SEM image of the entire pellet at a magnification of 15X. b-d) 50X magnification views of the pellet surface. b) back-scatter image, c) EDS overlay with (red) chlorine and (blue) titanium, and d) EDS overlay of only titanium. e-g) 250X magnification views of the pellet surface. e) back-scatter image, f) EDS overlay with (red) chlorine and (blue) titanium, and g) EDS overlay of only titanium. Image and sample courtesy of James Chris Thomas (Dr. Eric Petersen, MEEN)
September 2020
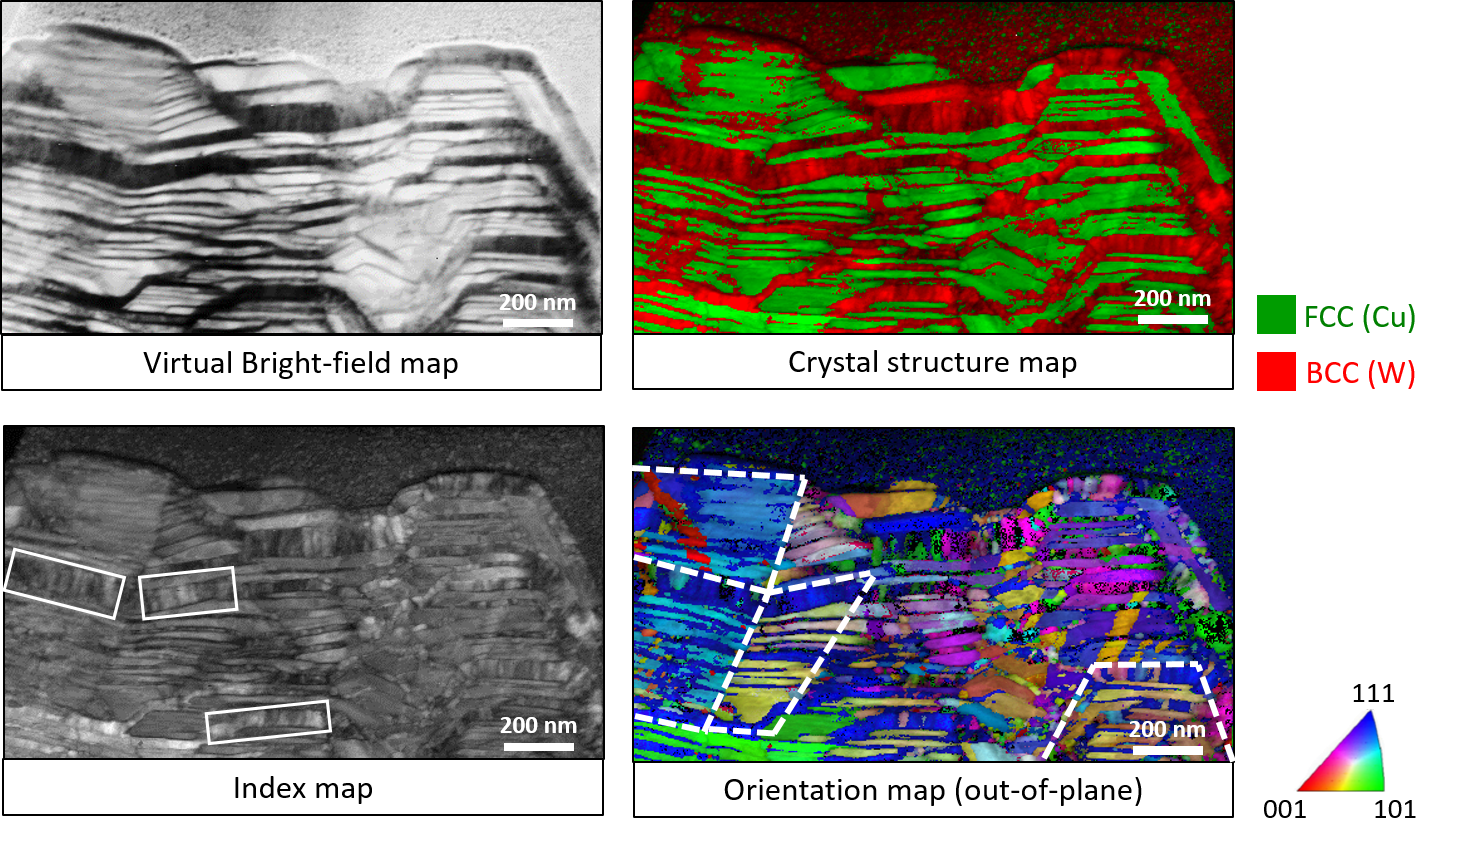
The sample is a phase-separated Copper-Tungsten nanocomposite prepared via physical vapor co-deposition. As opposed to well-studied multilayers where the elements are deposited sequentially, we explored nanocomposites where elements are deposited simultaneously. Along with a unique hill-shaped morphology, we observed novel crystallographic character in these nanocomposites. This novel persistent crystallographic orientations in successive Cu-W nanolayers gives rise to the formation of regions which we term as “supergrains”.
We used the NanoMegas ASTAR® system in conjunction with FEI Tecnai G2 F20 TEM to perform precession electron diffraction (PED). The minimization of dynamical effects in PED improves the orientation mapping capabilities.
The Virtual bright-field map is acquired by mapping direct beam intensity. This highlights the phase-separated Copper (Cu)-Tungsten (W) nanolayered morphology. The mass thickness contrast results in Cu appearing bright and W appearing dark.
The Crystal structure map is acquired by analyzing the diffraction patterns at each pixel. The face-centered cubic Cu and body-centered cubic W appear in good agreement with the virtual bright-field image.
The Index map is acquired by analyzing the diffraction patterns at each pixel. The low angle grain boundaries in a each W nanolayer marked by white boxes.
The Orientation map (out-of-plane): highlights the novel persistence of crystallographic orientations in successive W and Cu nanolayers is highlighted white dashed lines. We term these regions as “super grains”.
Image taken on FEI Tecnai G2 F20 TEM-Materials. Image courtesy of Digvijay R. Yadav (Dr. Kelvin Xie, Materials Science & Engineering) and sample courtesy of Dr. Kelvin Xie (MSEN) and Dr. Michael Demkowicz (MSEN).
August 2020
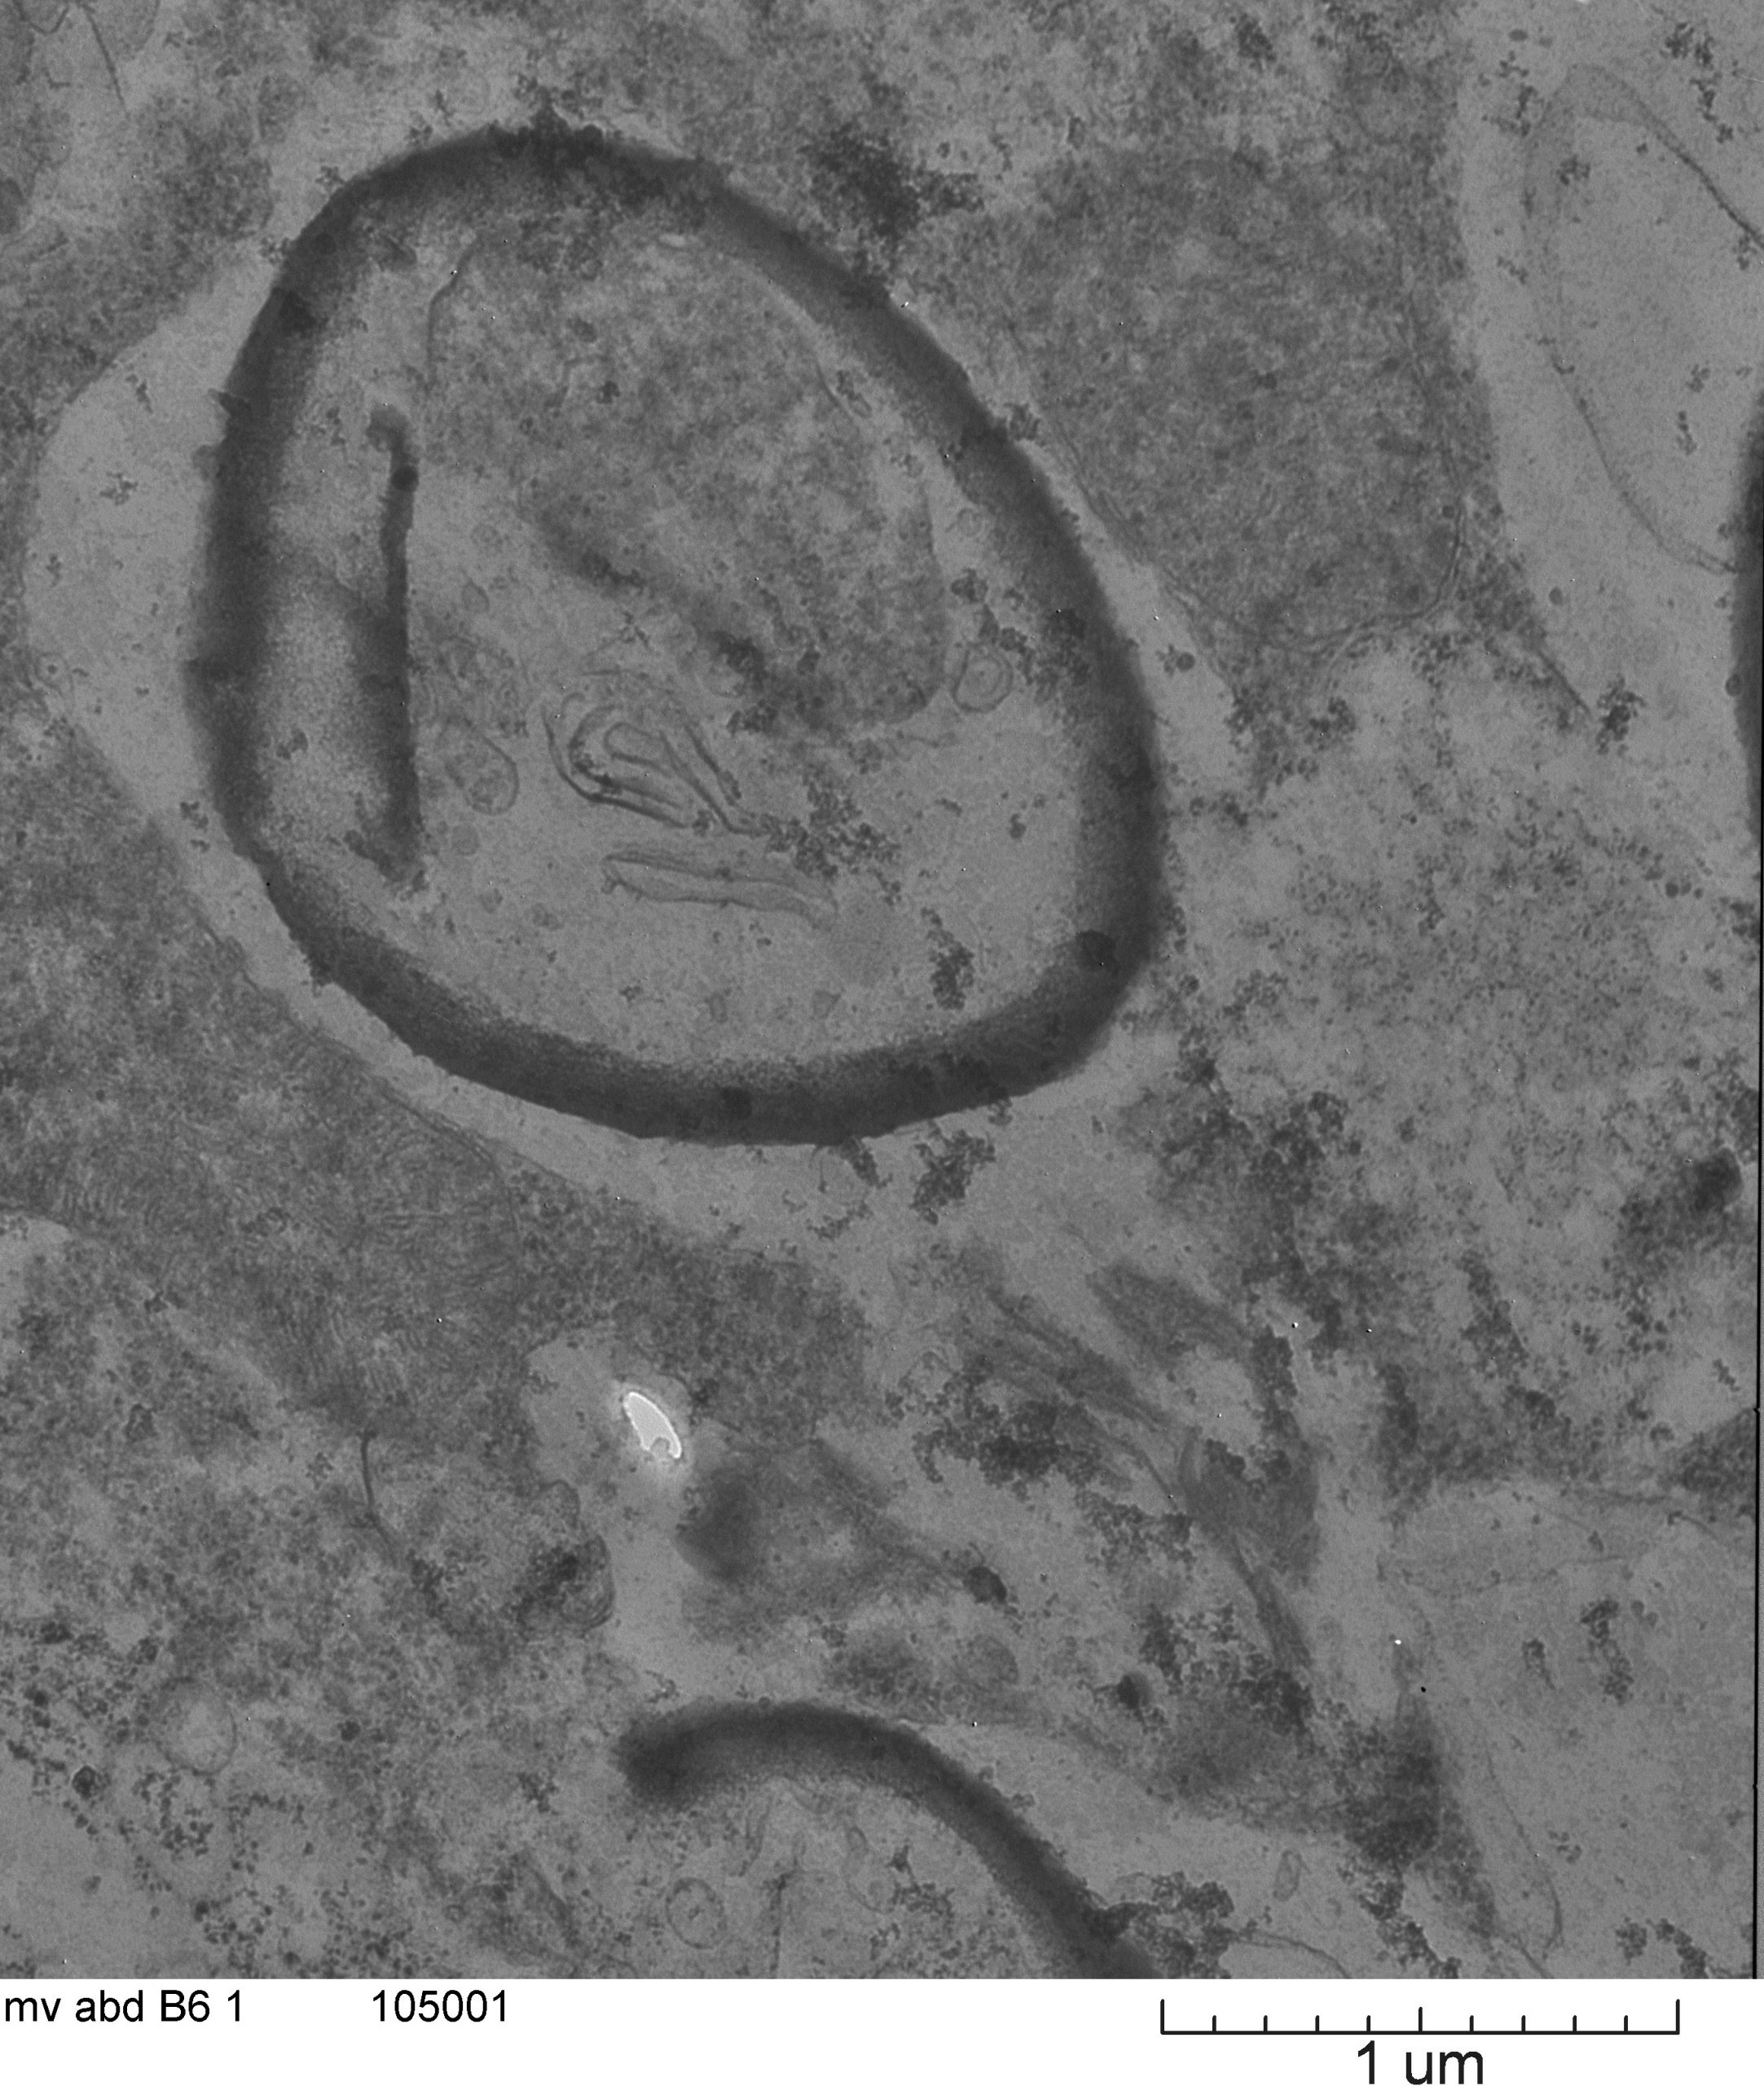
This is a picture from the abdomen of the rice delphacid, an insect pest on rice. This picture is possibly showing an endosymbiont (Cardinium) that has not been described in this insect species. Insects will be tested with PCR primers for Cardinium to confirm that this bacteria is present in the insect species and therefore what is shown in this image. Image taken on JEOL 1200 at ~20X magnification. Image courtesy of Jaclyn Martin (Dr. Keyan Zhu-Salzman, Entomology) and sample courtesy of Dr. Maribel Cruz.
March 2020
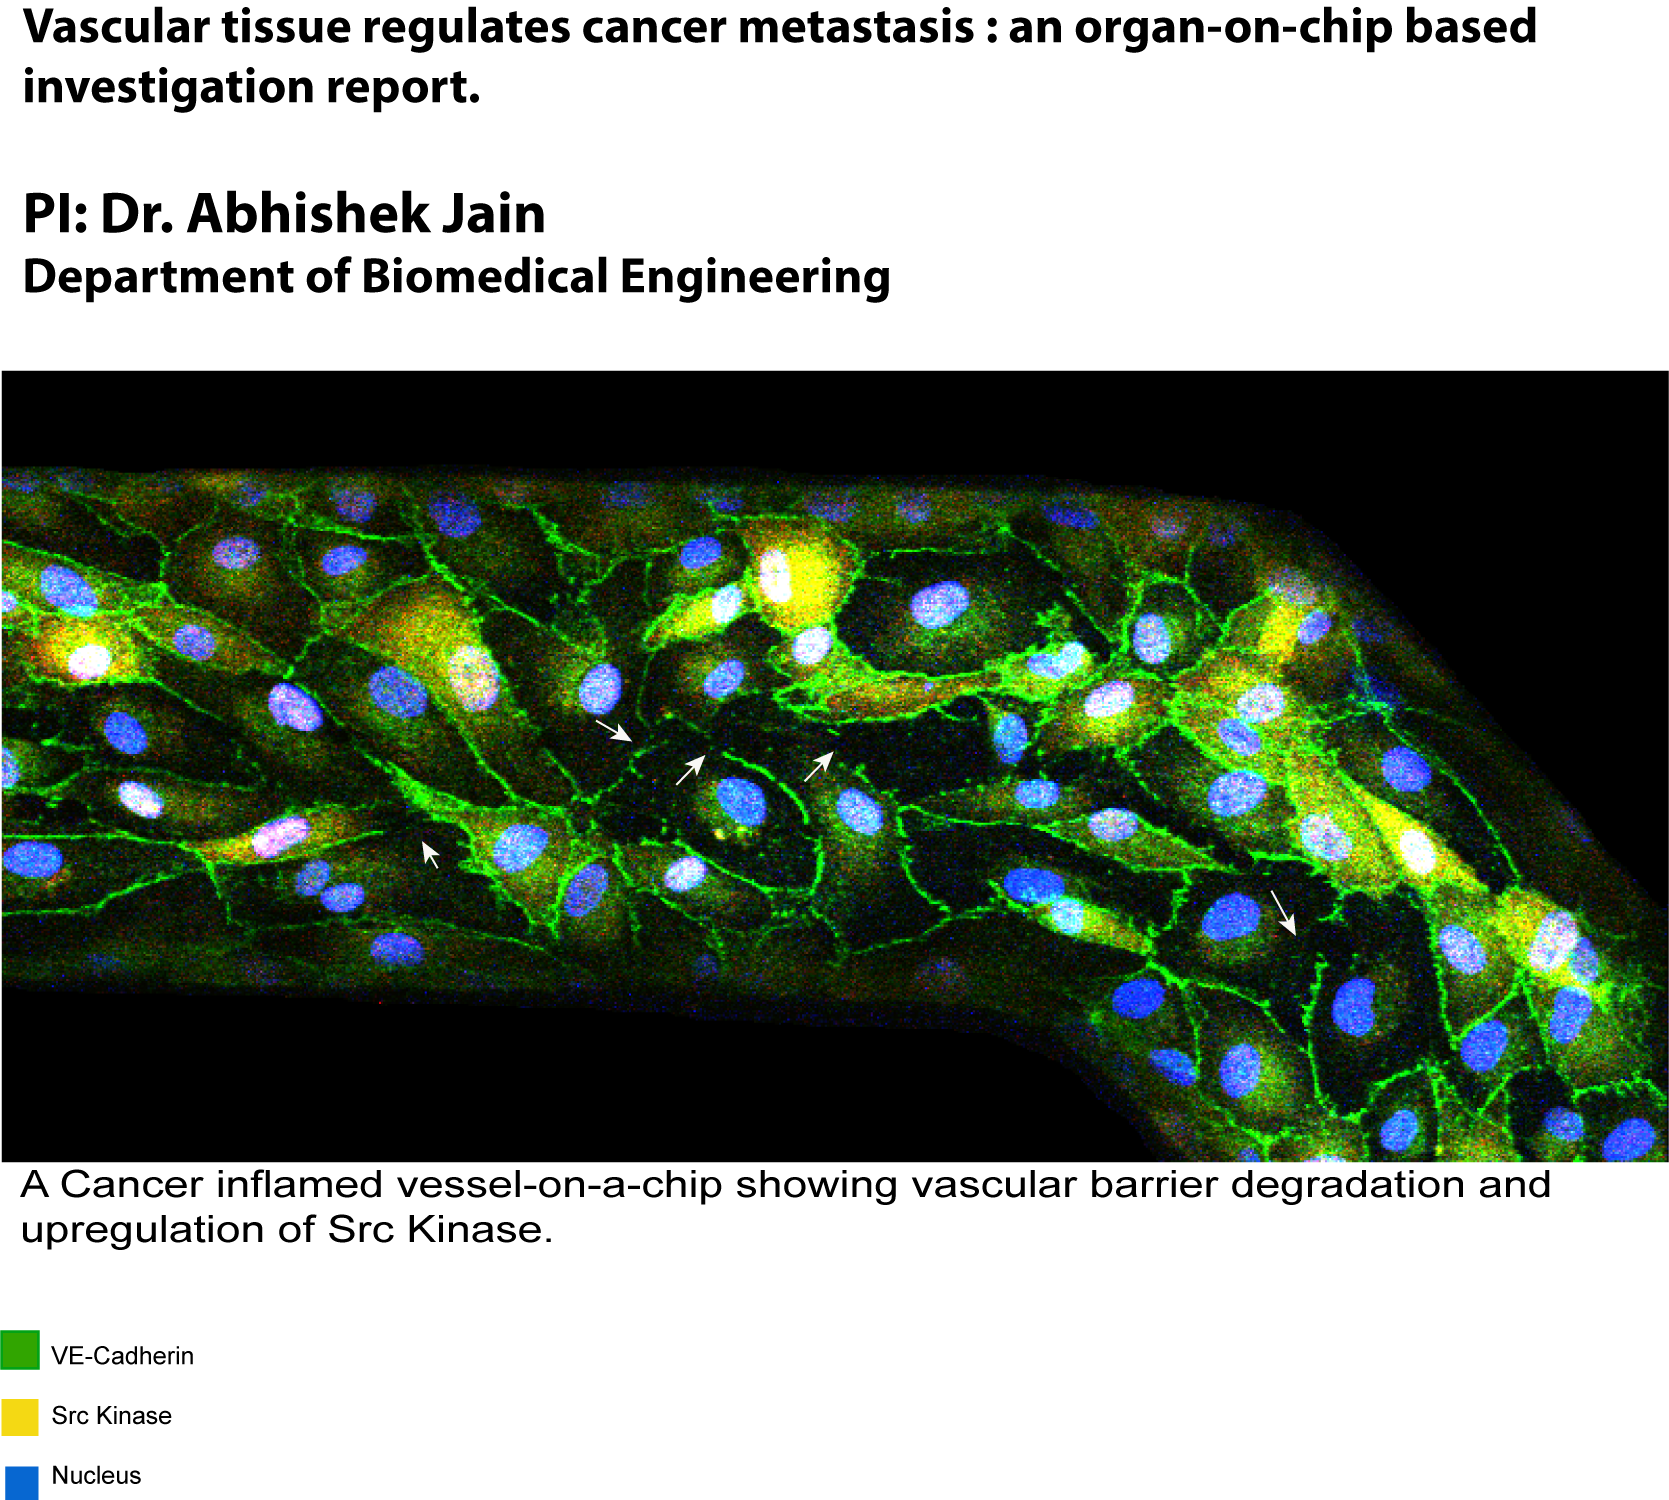
This sample is an artificially created blood vessel inside organ-on-chip co-cultured with tumors that is fixed and stained for vascular cell adhesion junctions and key barrier regulatory proteins. Degradation of adhesion junction protein VE-Cadherin (green) is observed in the vessel due to cancer inflammation with a distinct up-regulation of Src kinase (yellow). This vascular dysfunction further provides routes to the blood platelets for extravasation into the tumors that promotes metastasis. Image taken on Olympus FV1000 confocal at 400 micron X 200 micron field of view and 20X magnification. Image courtesy of Dr. Stanislav Vitha and sample courtesy of Biswajit Saha (Biomedical Engineering).
February 2020
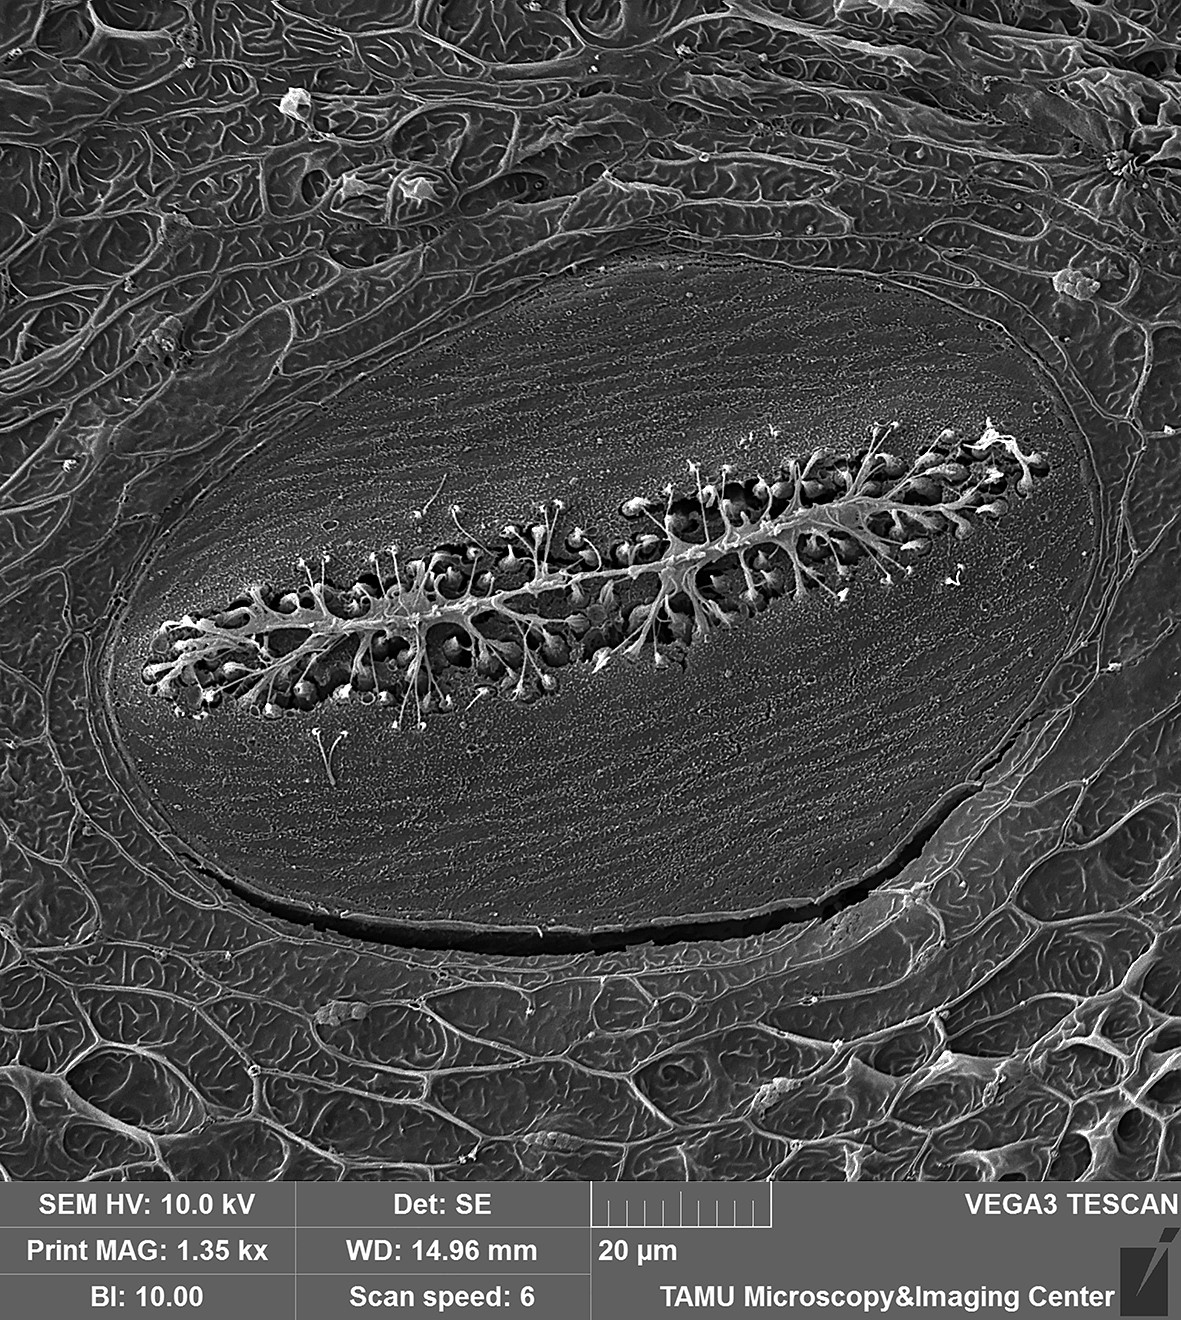
Superficial neuromast organ on head of Blackwing hatchetfish (Carnegiella myersi). The over 300 superficial neuromast organs on the surface of the head of this species facilitate the detection of minute vibrations caused by struggling insects at the waters surface, which are then captured and consumed by this tiny predator. The sensory cilia (kinocilia and stereocilia) extending from the hair cells along the center of the neuromast are clearly visible in this image. Image taken on the Tescan Vega with a field of view at ~140 microns. Sample and image courtesy of Dr. Kevin Conway (Ecology and Conservation Biology).
January 2020
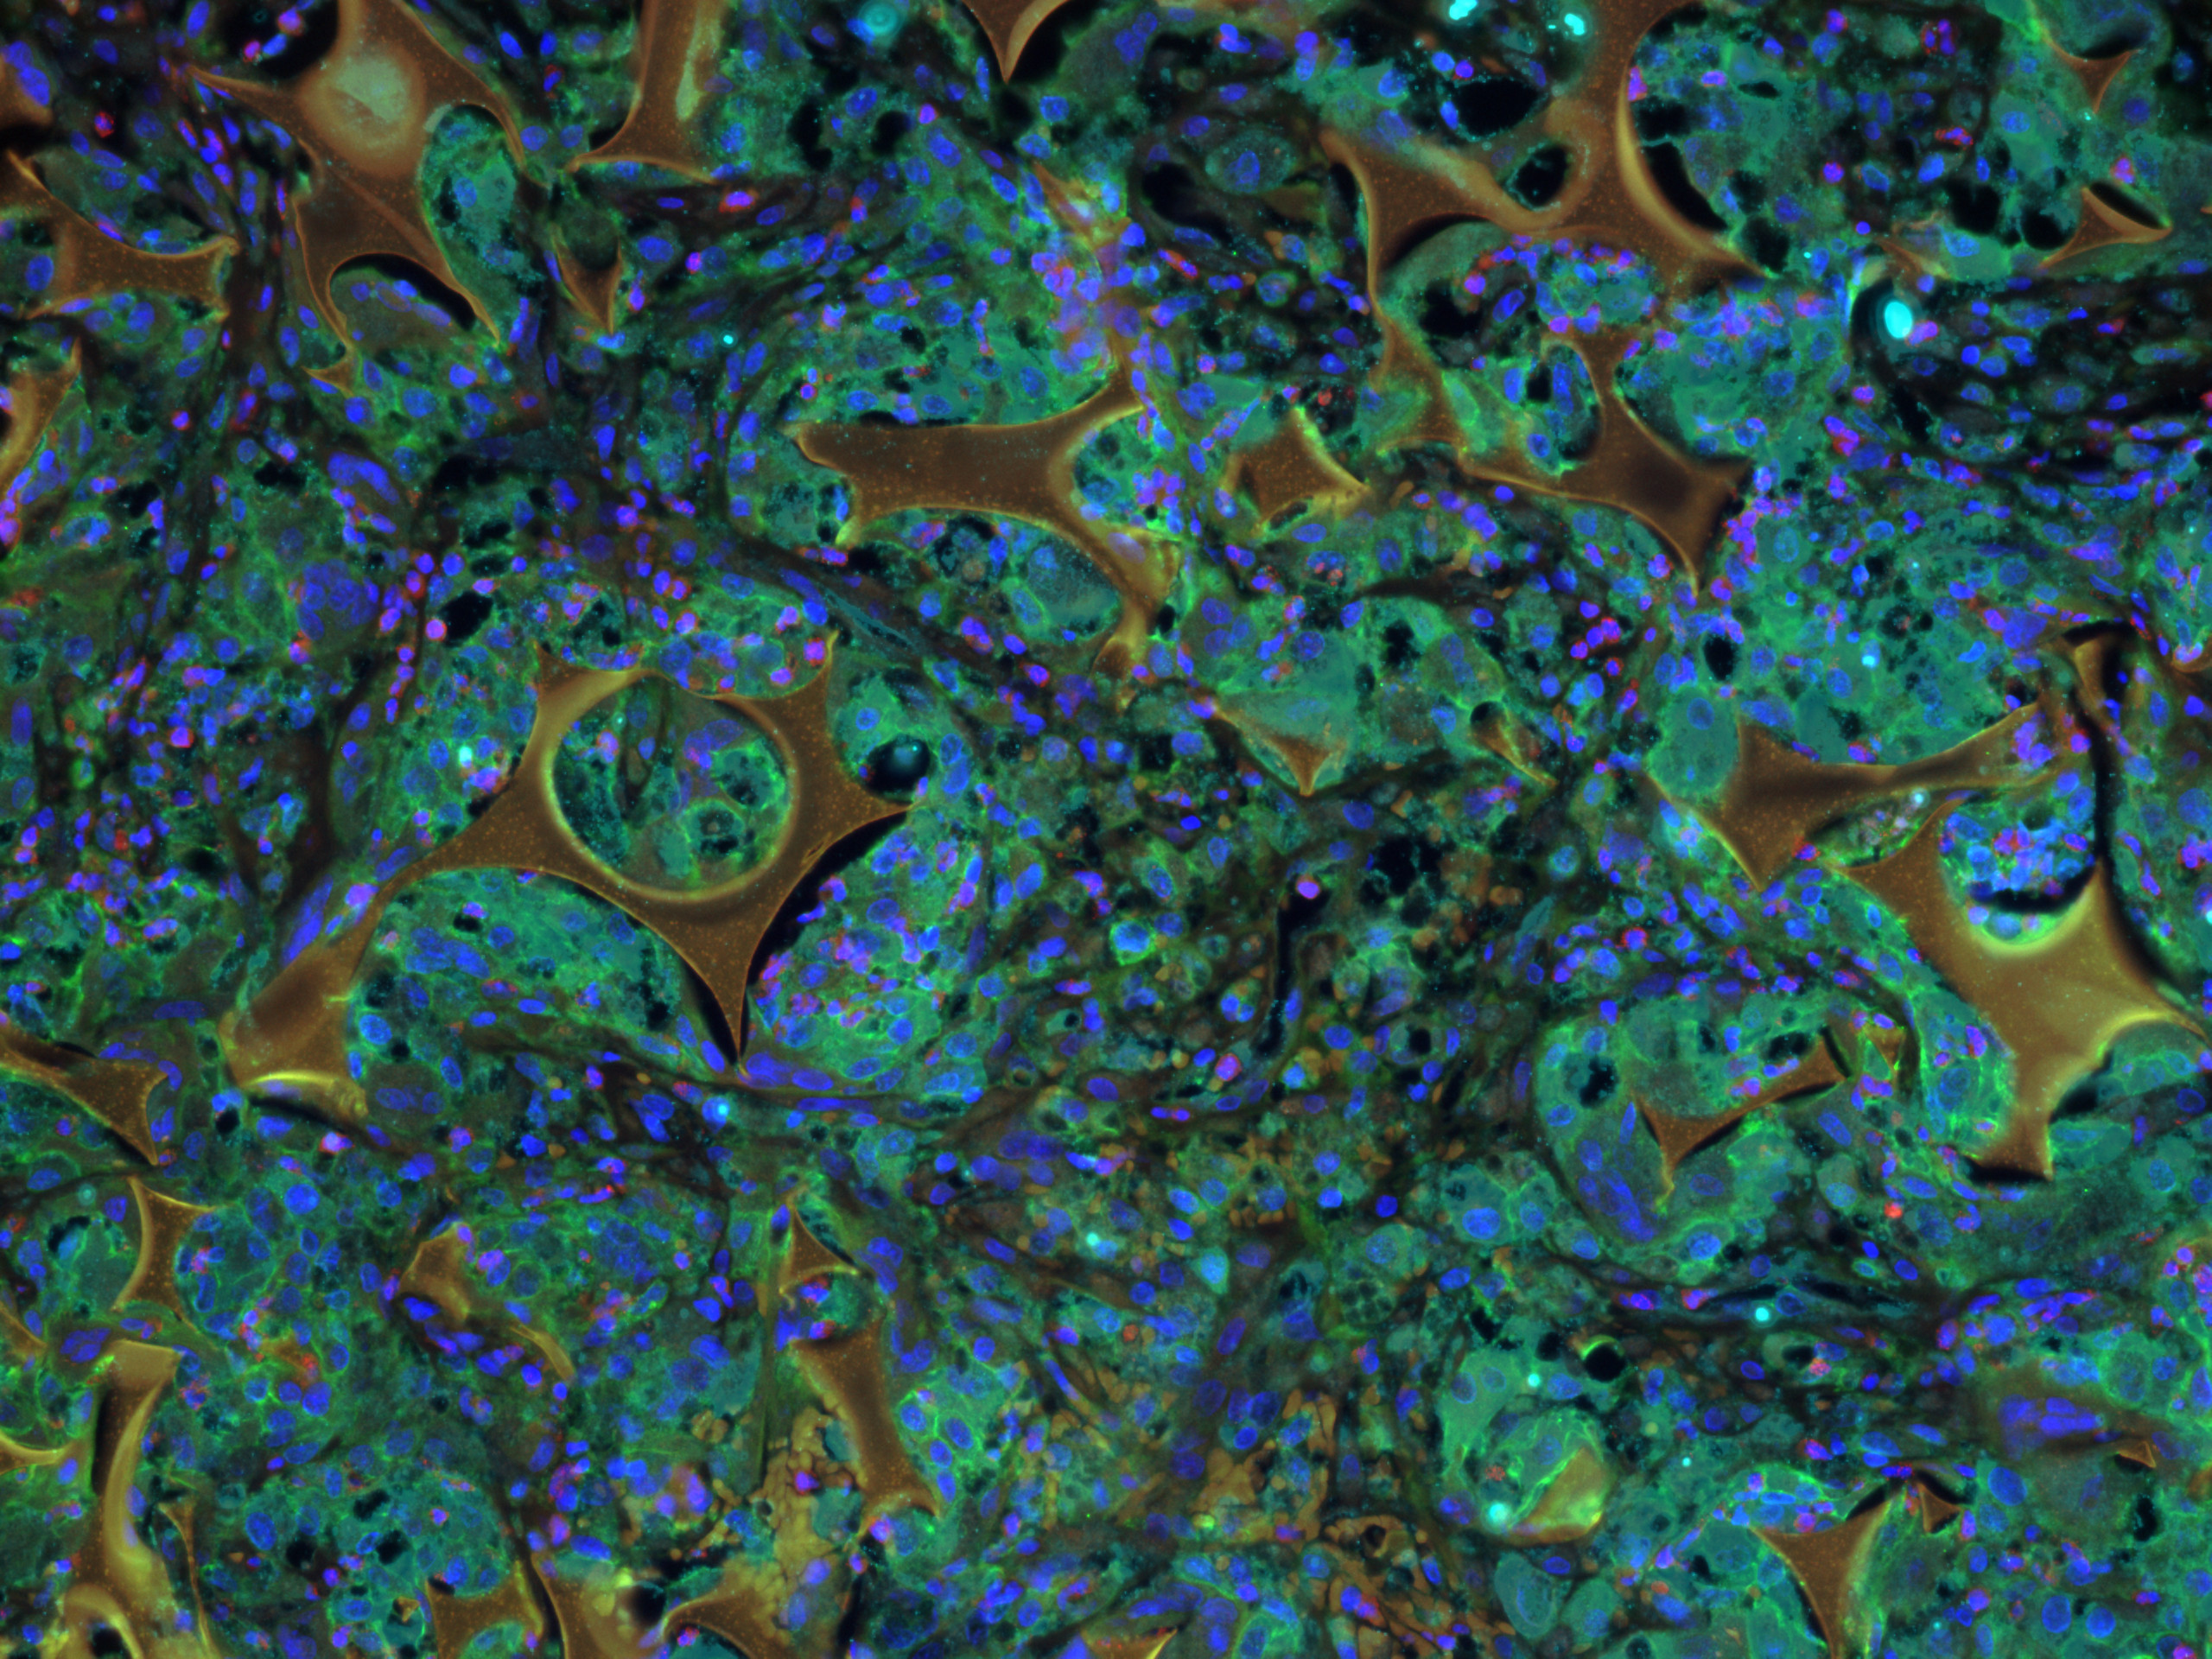
Shape memory polymer foam-coated coils were used to occlude rabbit aneurysms. The larger golden shapes are shape memory polymer foam. Immunofluorescent staining shows cell nuclei (blue), macrophages (green), pro-inflammatory macrophages (cyan), and anti-inflammatory macrophages (red) present 30 days after device implantation. Image taken on Leica DM6B at 20X magnification. Image and sample courtesy of Scott Herting and Dr. Duncan Maitland (Biomedical Engineering).
December 2019
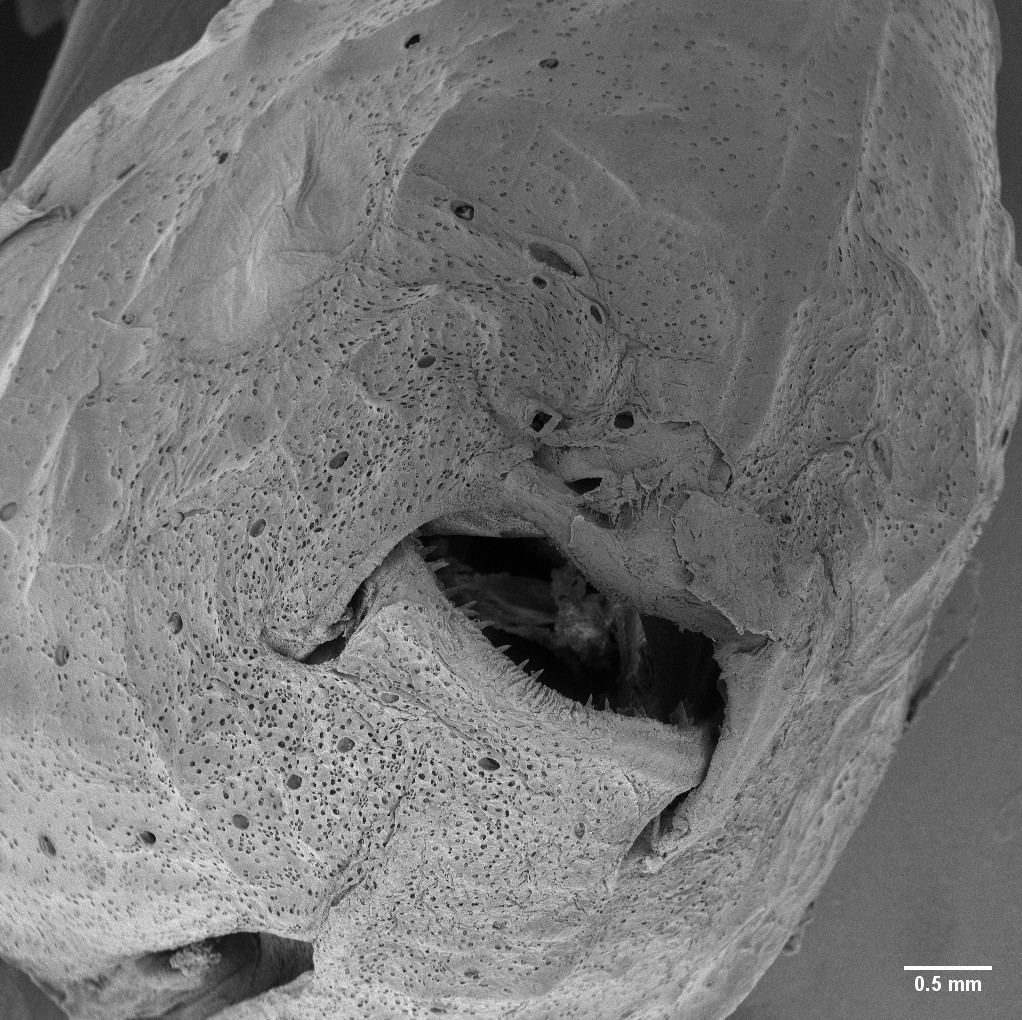
Head of weakly electric fish, Eigenmannia trilineata. The incredibly abundant small pores are those of electroreceptors. The large right eye, visible on the left side of the image, is devoid of electroreceptor pores. Image was captured using the Tescan Vega. The field of view is 5.72mm, WD: 28.38mm, Mag: 48x. Image courtesy of David Saenz (Wildlife and Fisheries Sciences, Dr. Kirk Winemiller’s group) and sample courtesy of the TAMU Biodiversity, Research, and Teaching Collections.
November 2019
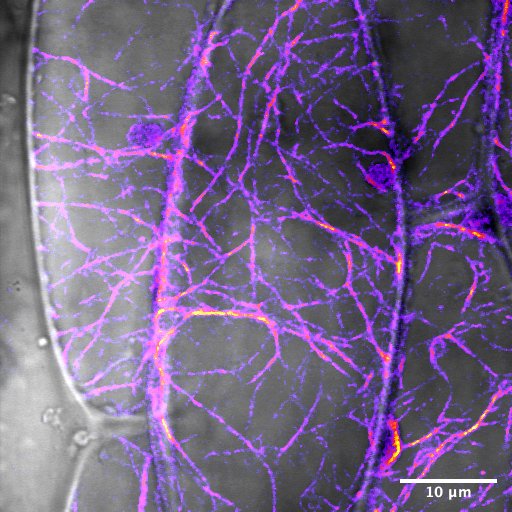
Surface hypocotyl cell of Arabidopsis thaliana seedling with YFP-actin. Image was captured using the Olympus FV1000 Confocal using a 60X water immersion objective. The field of view is 52.74 x 52.74 um and 512×512 pixels. The YFP/CFP high sensitivity detector was used and the image was processed with a 1-median pixel filter and a Fire LUT was applied to the actin channel. It was then merged with the bright field channel to create a composite image. Image courtesy of Sara Maynard and sample courtesy of Dr. Lawrence Griffing (Biology).
October 2019
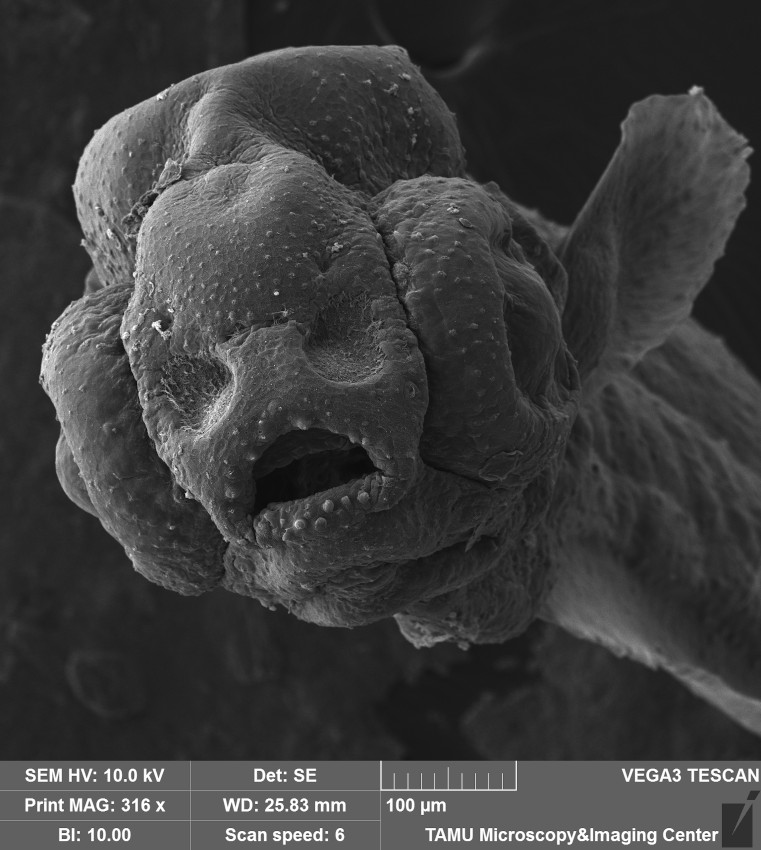
3mm larva of Danionella Dracula, a progenetic fish from South Asia and an emerging model in neuroscience and aging studies. Image was captured on the Tescan Vega SEM as an oblique anterolateral shot with the scale bar in the image. Image and sample courtesy of Dr. Kevin Conway (Wildlife & Fisheries Sciences)
August 2019
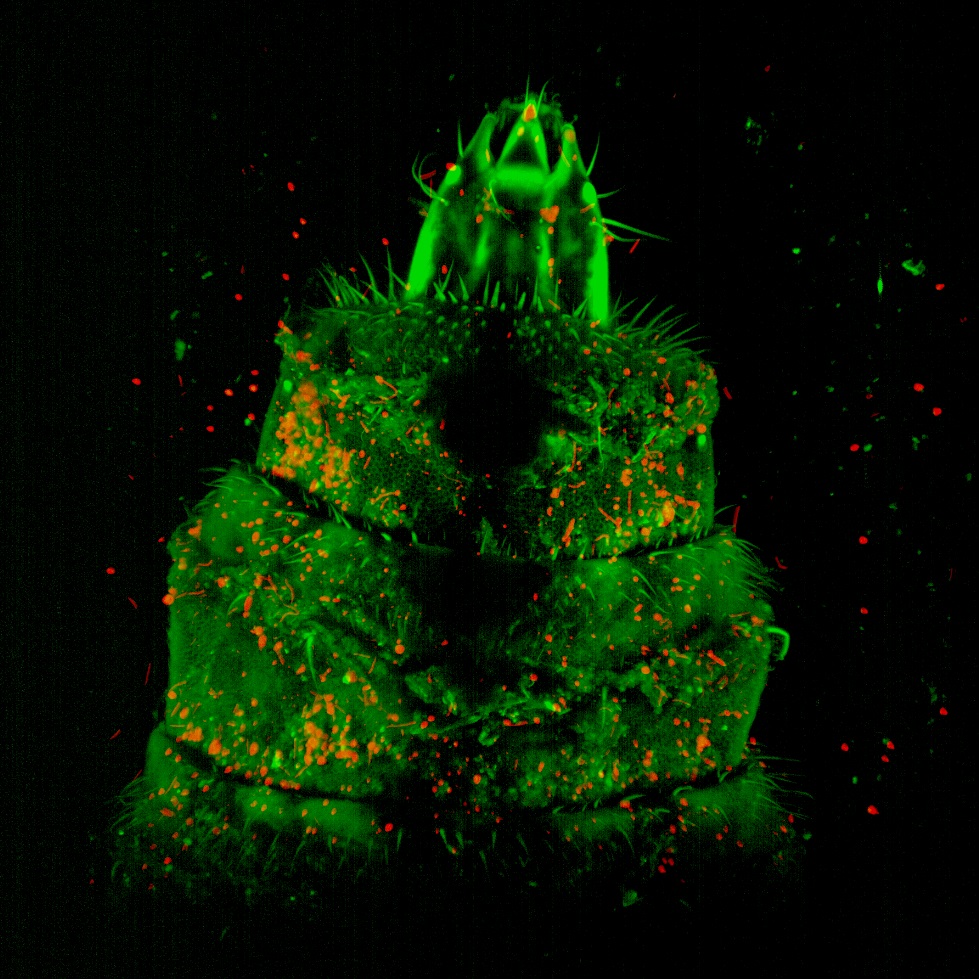
Tipulidae larva (crane fly) autofluorescence rendered as maximum intensity projection imaged with the Z.1 light sheet fluorescence microscope. Field of view is 5mm. Image and sample courtesy of Dr. Holly Gibbs. This image is part of a larger series of images that is part of a community outreach project to capture the microscopic details of flora and invertebrate fauna local to the Brazos Valley with light sheet fluorescence microscopy.
February 2019
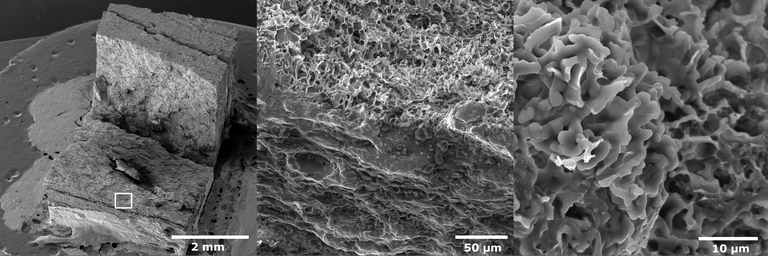
Scanning electron microscopy (SEM) image of extruded pea protein. Sample courtesy of Dr. Taehoon Kim (PI: Dr. Mian Riaz, Process Engineering R& D Center). The freeze – dried sample was sputter-coated with gold and imaged in Tescan Vega SEM at 10 kV accelerating voltage by Dr. Stanislav Vitha. Magnification 26x, 720x, and 4100x was used (left, middle and right panels, respectively). The rectangle in the left panel indicates the area captured at higher magnification in the middle panel.
January 2019
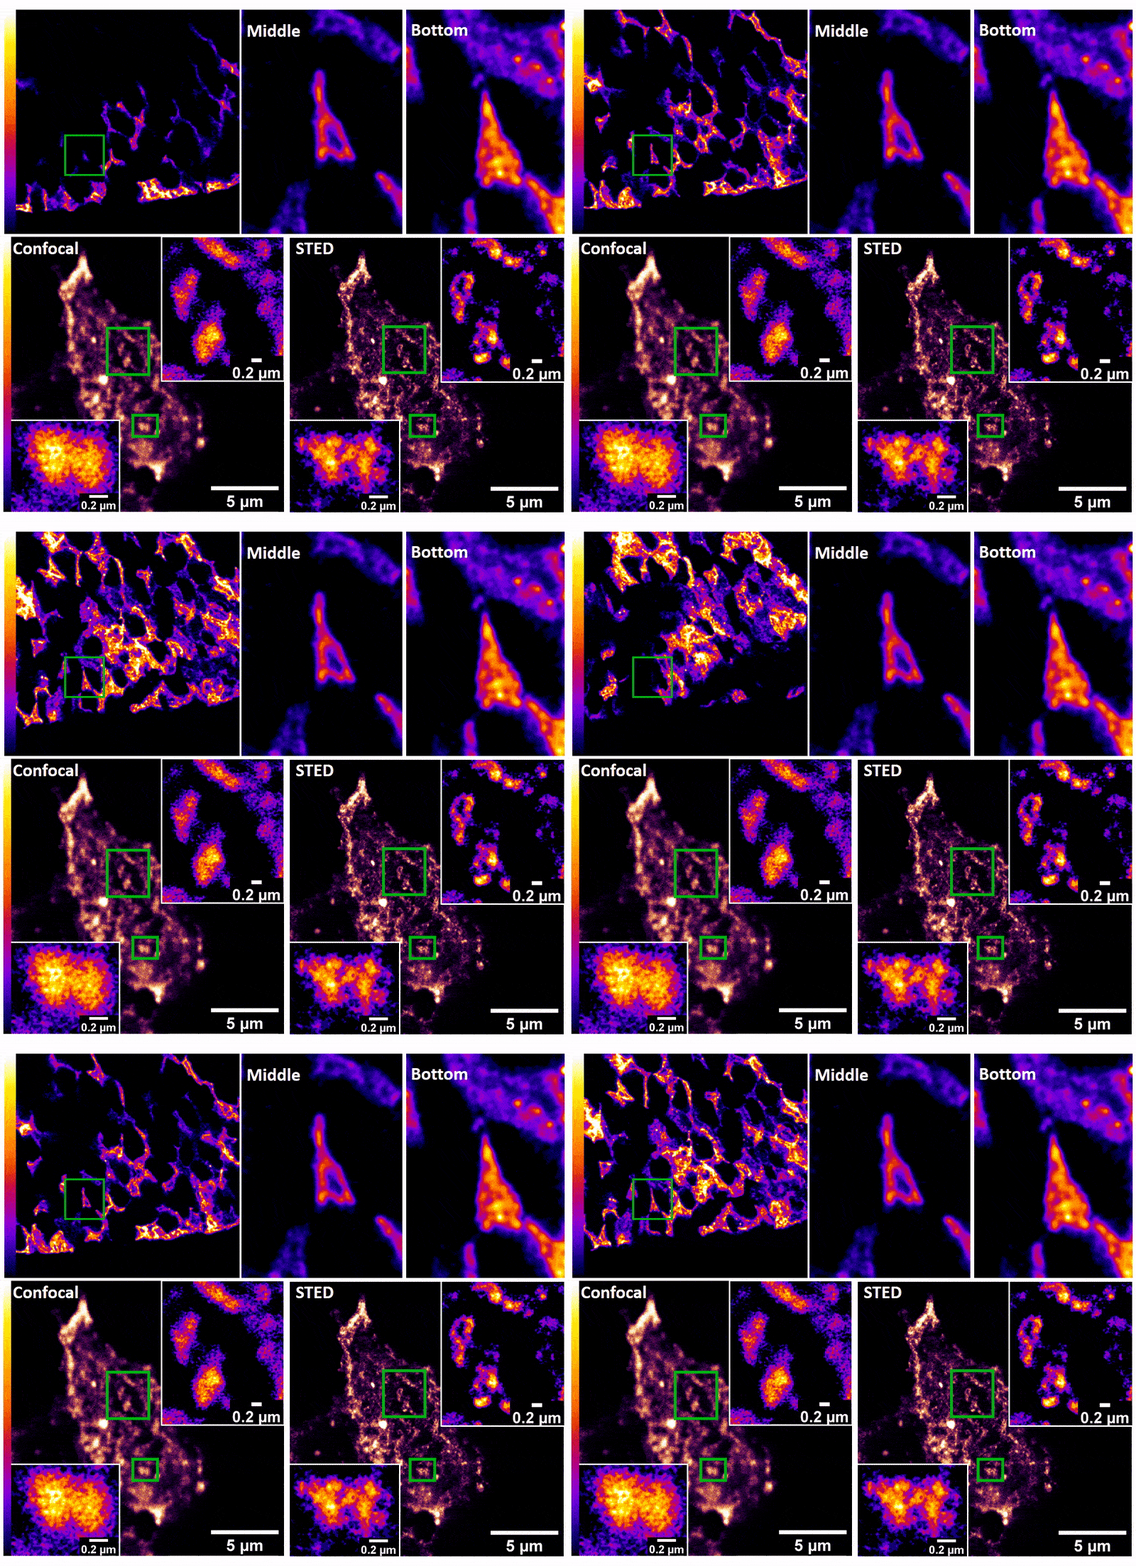
Confocal z-stack and comparison of confocal vs STED images of Drosophila gut stem cells expressing chimeric (human extracellular, drosophila intracellular) epidermal growth factor receptor (EGFR) labeled with fluorescently conjugated (Alexa 594) anti-human EGFR antibody (Cetuximab). The STED technique is compatible with drosophila gut tissue and provides a significant resolution improvement over confocal, allowing the nanoscale determination of protein clustering in vivo.
Images were acquired on the new Leica SP8 Confocal, STED, and Falcon (FLIM) system microscope by Dr. Robert Fuentes (Dr. Chapkin’s group, Nutrition and Food Science). The sample was prepared by Dr. Mohamed Mlih (Dr. Karpac’s group, Molecular and Cellular Medicine).
June 2018
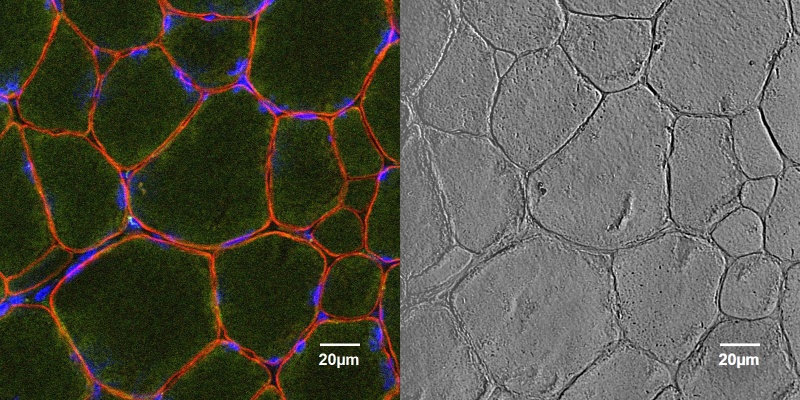
Cross section of healthy canine muscle tissue stained for dystrophin (red), nuclei located in the periphery can be seen stained with DAPI (blue). Dystrophin is a protein present in the sarcolemmal membrane that is required for healthy muscle growth and development. The lack of dystrophin can cause severe diseases such as Duchenne and Becker Muscular Dystrophy. The sample was processed by Sara Mata, a PhD Candidate from the Kornegay lab.
June 2017
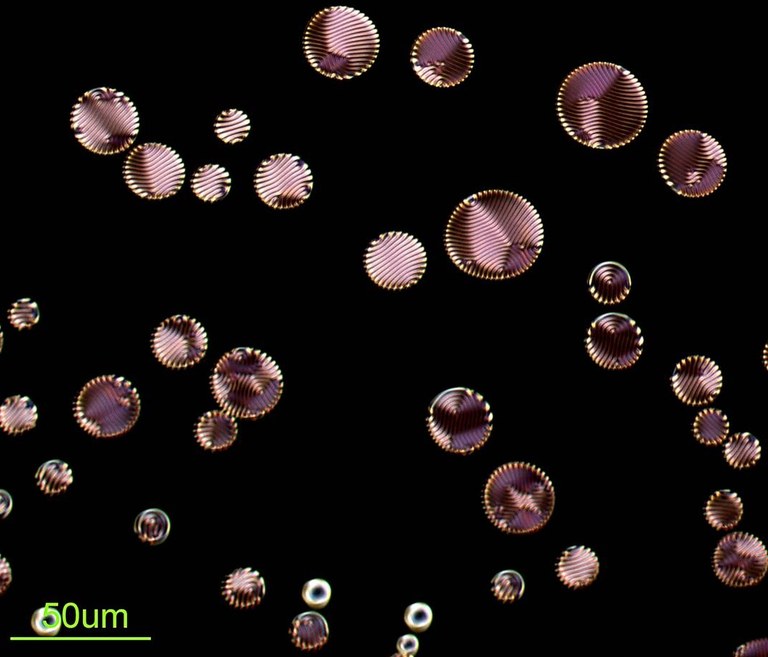
Chiral nematic liquid crystals (CLCs) are known to exhibit self-organized helical superstructures. The image shows the polarized optical microscope texture of CLCs dispersed in an isotropic medium, where finger print textures are interestingly observed inside the microspheres. Image acquired on Zeiss Axiophot microscope, by Ling Wang (Dr. Zhengdong Cheng’s lab, Chemical engineering)

December 2015
Section of mouse lungs immunofluorescently labeled for Collagen IV (Green) and CD45 (Red). Image courtesy Dr. Darrell Pilling, Department of Biology.
Olympus FV1000 confocalmicroscope, 20x/0.85 oil immersion objective.
September 2014
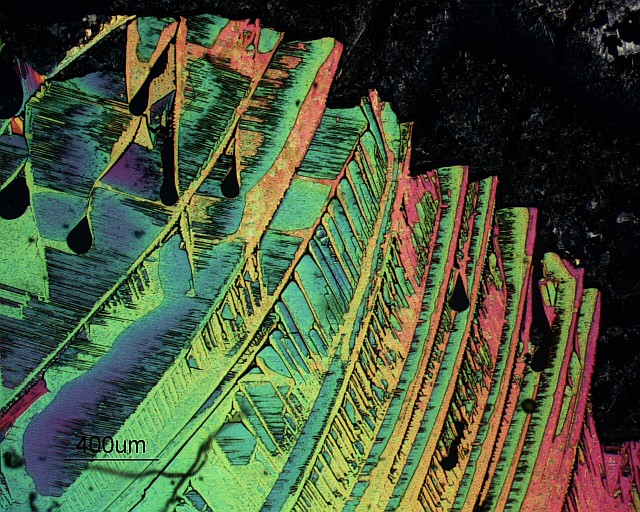
Circular polariscopy micrograph of urea crystals on glass. Image acquired on a Zeiss Axiophot microscope with a 2.5x objective.
The basic advantage of a circular polariscope over a plane polariscope is that in a circular polariscope setup we only get the isochromatics and not the isoclinics. This eliminates the problem of differentiating between the isoclinics and the isochromatics. http://en.wikipedia.org/wiki/Photoelasticity
Note: Isoclinics are the loci of the points in the specimen along which the principal stresses are in the same direction. Isochromatics are the the lines which join the points with equal maximum shear stress magnitude.
June 2014
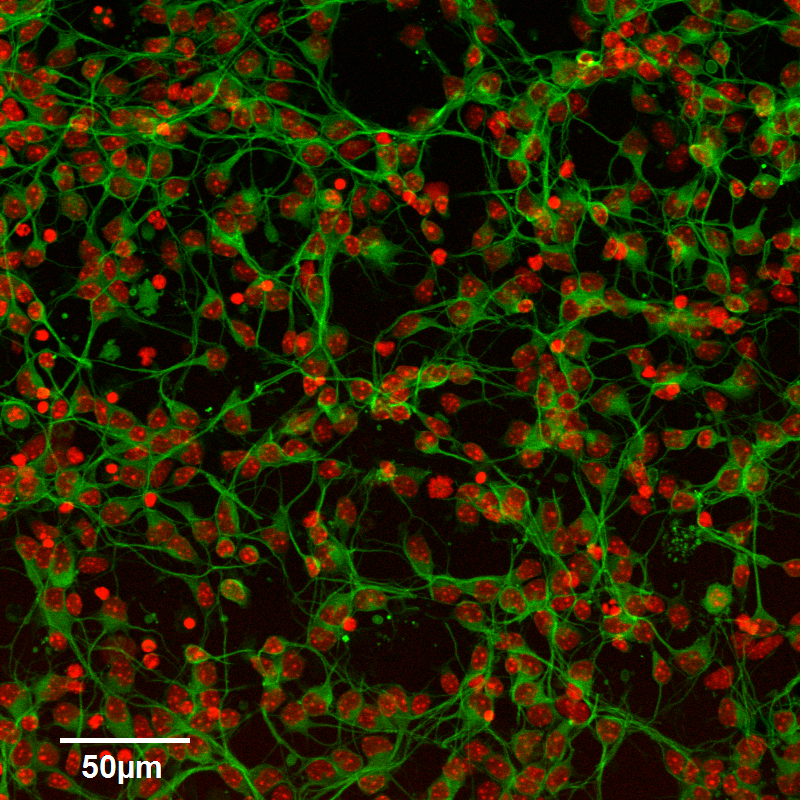
Confocal image of cultured neurons. Indirect immunofluorescence staining (Green) and DNA (Red). Imaged with a long-working 20x/0.8 objective. Image by Dr. Stanislav Vitha. Sample courtesy of Dr. Deeann Wallis (Dr. Sacchettini’s group, Biochemistry and Biophysics).

November 2013
Laser scanning confocal image of human ovarian cancer cell line NCI/ADR-RES stained with DAPI (green) and with anti-ABCB1 (red) antibody recognizing a drug efflux pump known to play a major role in resistance to chemotherapy treatments. Sample courtesy of Dr. Deeann Wallis (Dr. Sacchettini’s group, Biochemistry and Biophysics) from a project on novel drugs that resensitize drug resistant cancers to chemotherapy.
Imaging performed on the Olympus FV1000 confocal microscope by Dr. Stanislav Vitha.
September 2013
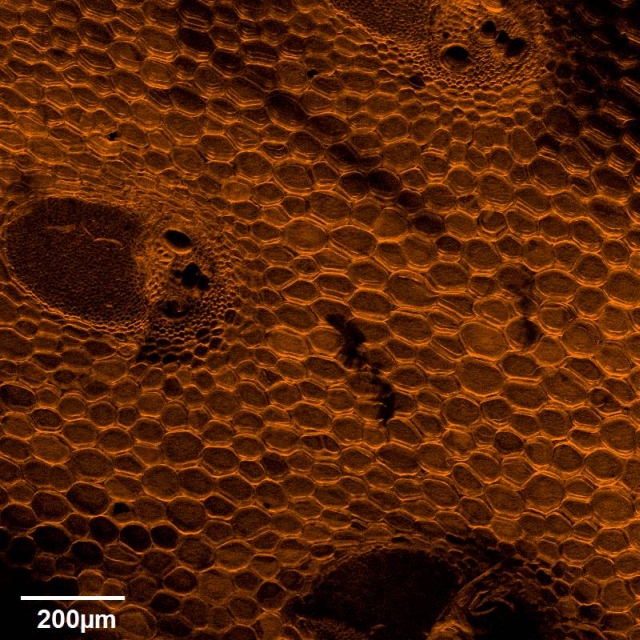
Broom corn stem cross section. Cell walls were fluorescently stained with Pontamine Fast Scarlet 4B and imaged on Olympus FV1000 confocal microscope using a 10x objective. Image by Robert Anderson (Department of Biochemistry and Biophysics, laboratory of Dr. John Mullet)
March 2013
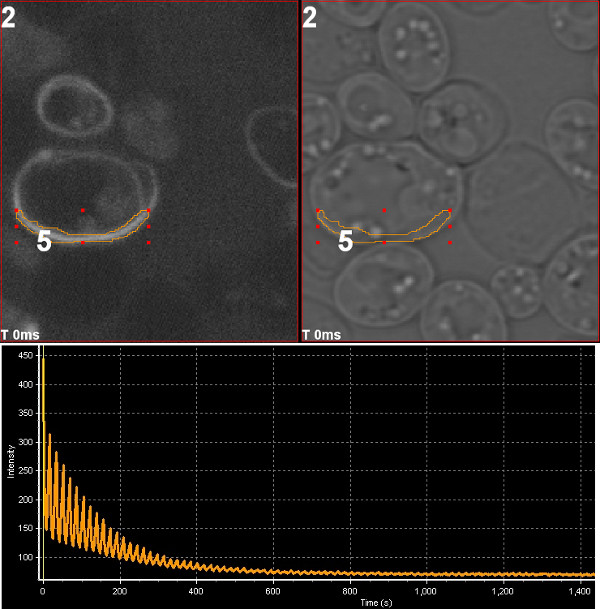
Photoswitching of mOrange2 fluorescent protein. The chloroplast division protein FtsZ2 tagged with mOrange2 was expressed in yeast and imaged using Olympus FV1000 confocal microscope. Repeated excitation with 543 nm laser drives the fluorescent protein to dark state and the fluorescence signal declines. The sample was then illuminated with 405 nm laser which converts mOrange2 from the dark state to the fluorescence-capable state, leading to elevated fluorescence signal at the beginning of the next excitation sequence. Image by Stanislav Vitha, MIC.
July 2012
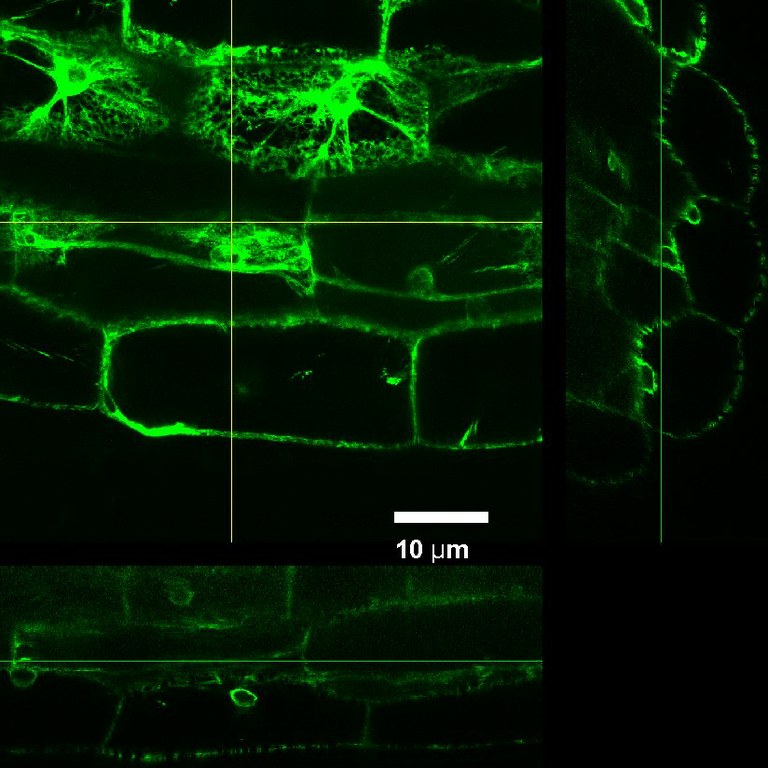
ER-targeted Green Fluorescent Protein expressed in tobacco, imaged using Olympus FV1000 confocal microscope and a silicon immersion 60x/1.3 objective . The XZ and YZ panels show very good depth of imaging achieved in this highly scattering tissue. Sample courtesy Dr. Lawrence Griffing, Department of Biology. Imaging performed by Dr. Stanislav Vitha, MIC.
February 2012
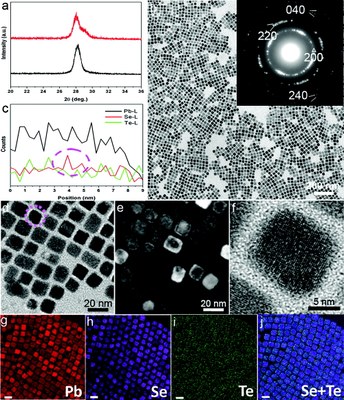
Imaging core/shell structures in PbSeTe nanocubes. (a) XRD patterns of PbSeTe core/shell nanocubes (red) and Pb3Se2.8Te0.2 single ternary alloy nanocubes (black). (b,d) TEM images [inset of (b): SAED pattern] and (c) HAADF-STEM EDS line scan profile of PbSeTe core/shell nanocubes. (e) WBDF image. (f) HRTEM image of a single PbSeTe core/shell nanocube. (g–j) Elemental maps of Pb (red), Se (purple), Te (green), and their Se+Te overlap, respectively; scale bar, 20 nm. The TEM work was done by Dr. Zhiping Luo, and published on J. Am. Chem. Soc.133 (44), 17590–17593 (2011). [Abstract] [HTML] [PDF]
December 2011
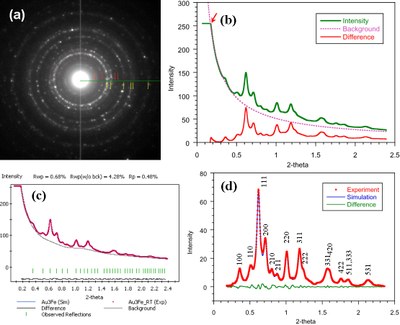
Quantitative analysis of electron diffraction pattern (EDP). (a) EDP taken from Au-Fe nanoparticles; (b) intensity profile, as well as the difference after subtracting the simulated background using the power law; (c) the Pawley refinement (refined background is shown); (d) reflection intensities after subtracting the refined background in (c). This work was published by Zhiping Luo, Yolanda Vasquez, James F. Bondi, and Raymond E. Schaak. Pawley and Rietveld refinements using electron diffraction from L12-type intermetallic Au3Fe1-x nanocrystals during their in-situ order-disorder transition. Ultramicroscopy 111 (8), 1295-1304 (2011). [HTML]
September 2011
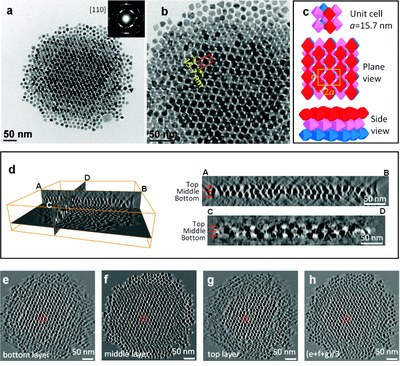
Self-assembled superlattice structure of octahedral Pt3Ni nanocrystals revealed by electron tomography. (a) TEM image and SAED; (b) magnified image of (a); (c) structure models of the bcc packing unit cell; (d) reconstructed volume; (e-g) slice view of bottom, middle, and top layers, respectively; (h) superimposition of (e-g). This work was performed by Dr. Zhiping Luo, and published by Jun Zhang*, Zhiping Luo*, Zewei Quan, Yuxuan Wang, Amar Kumbhar, Detlef-M. Smilgies, and Jiye Fang. Low Packing Density Self-Assembled Superstructure of Octahedral Pt3Ni Nanocrystals. Nano Lett.11 (7), 2912–2918 (2011). * Co-first authors. [Abstract] [HTML] [PDF]
June 2011
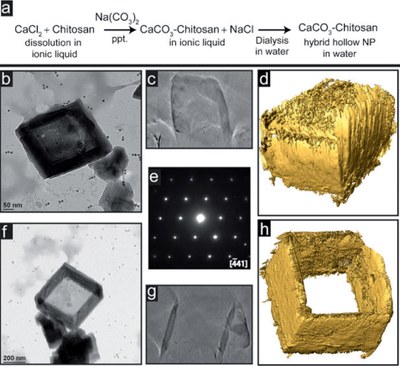
Nanoboxes and nanoframes studied by transmission electron microscopy. (a) Synthesis route; (b-d) TEM image, cross-sectional view of 3D reconstruction, and iso-surface of the nanobox with a lid on the top; (e) electron diffraction pattern showing single crystallinity; (f-h) TEM image, cross-sectional view of 3D reconstruction, and iso-surface of the nanoframe showing the open top. The TEM work was performed by Dr. Zhiping Luo, and published by Anna Chen, Zhiping Luo and Mustafa Akbulut, Chem. Commun.47 (8), 2312-2314 (2011).[Abstract] [Rich HTML] [PDF]
April 2011
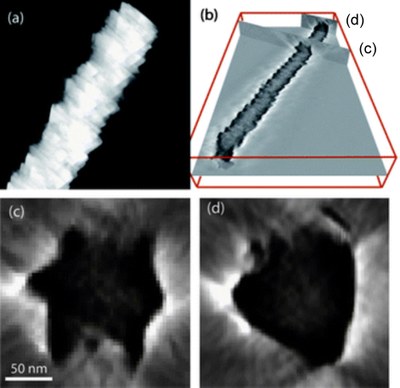
CuInSe2 nanowire revealed by electron tomography. (a) STEM image of a nanowire; (b) 3-D reconstructed volume, with two locations of the nanowire where cross-sectional views are obtained, as shown in (c) and (d) respectively. Images were taken by Dr. Zhiping Luo, and published on J. Mater. Chem. [Abstract] [Rich HTML] [PDF]
March 2011
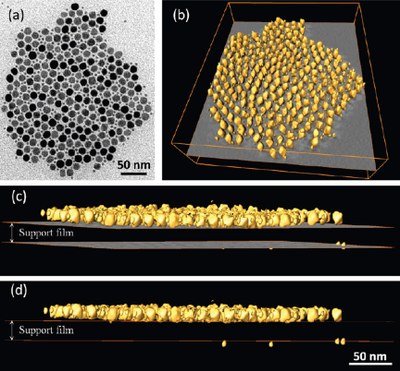
A superlattice pattern composed of In2O3 nanoctahedra and Pd spherical nanoparticles, assembled by opposite electrical charges. (a) TEM image; (b) reconstructed volume rendering; (c) close to edge-on side view of the volume; (d) edge-on side view of the volume. It is revealed that most of the Pd NPs locate on the middle plane of the In2O3 nanoctahedra well above the substrate surface (support film), rather than sitting on it. Images were taken by Dr. Zhiping Luo, and published on ACS Nano4 (4), 1821-1828 (2010).[Abstract] [Full text HTML] [PDF]
December 2010
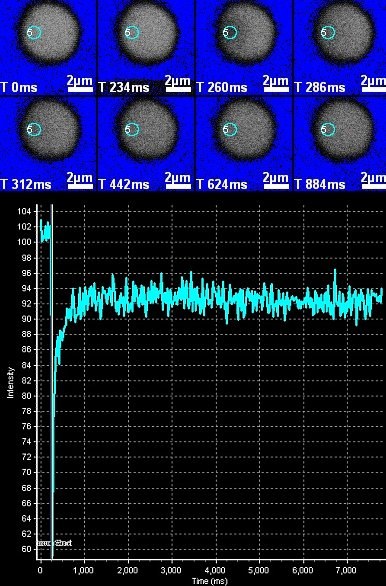
FRAP (Fluorescence Recovery After Photobleaching) analysis of a GFP-tagged transcription factor-like protein in Arabidopsis nucleus. TAIR Stock # CS84731 = line N7, which expresses a GFP fusion to a transcription factor-like protein (Cutler et al.,2000. PNAS 97(7),3718). Photobleaching using the SIM scanner on the Olympus FV1000 confocal microscope and bi-directional scanning permitted image acquisition at high frame rate, with the first post-bleach image (T=260ms) acquired less than 25 ms after bleaching (Bleach T= 227-238 ms). The region of interest (ROI) for bleaching and intensity measurement is indicated by the circle. Image acquired by Stanislav Vitha during the FRAP/RICS imaging tutorial in the MIC, December 1st, 2010.
July 2010
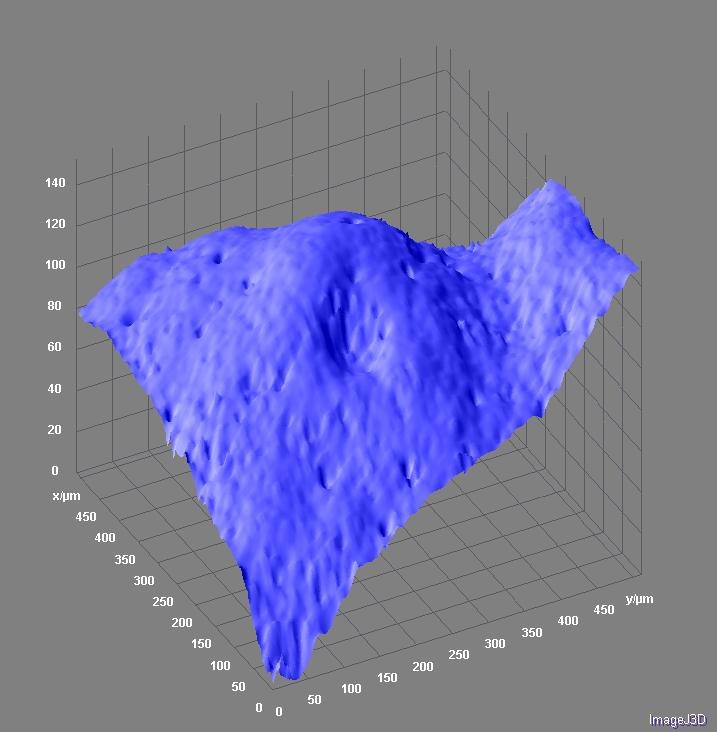
Surface topology of grapefruit peel. Topographical projection from a confocal z-stack was visualized with Surface3D plugin in ImageJ software. The scale is given in micrometers. Image by Stanislav Vitha.
May 2010
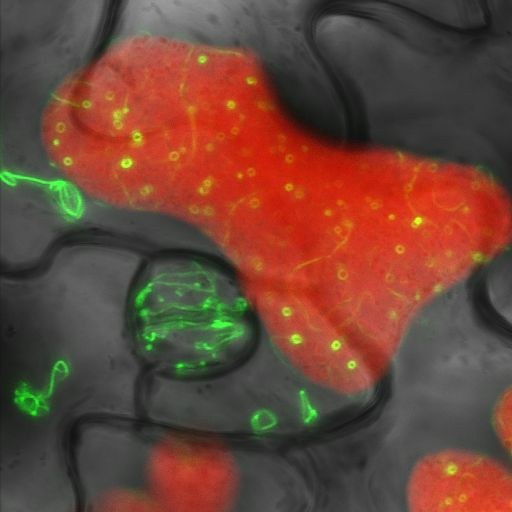
Leaf of a transgenic Arabidopsis thaliana plant expressing the tubulin-like chloroplast division protein FtsZ2 fused with Green Fluorescent Protein (GFP). The three-channel confocal image shows GFP fluorescence (green), chlorophyll fluorescence (red) and a transmitted bright-field image (gray). Image acquired by Stanislav Vitha on the Olympus FV1000 confocal microscope, using a 60x/1.2 water immersion objective.
February 2010
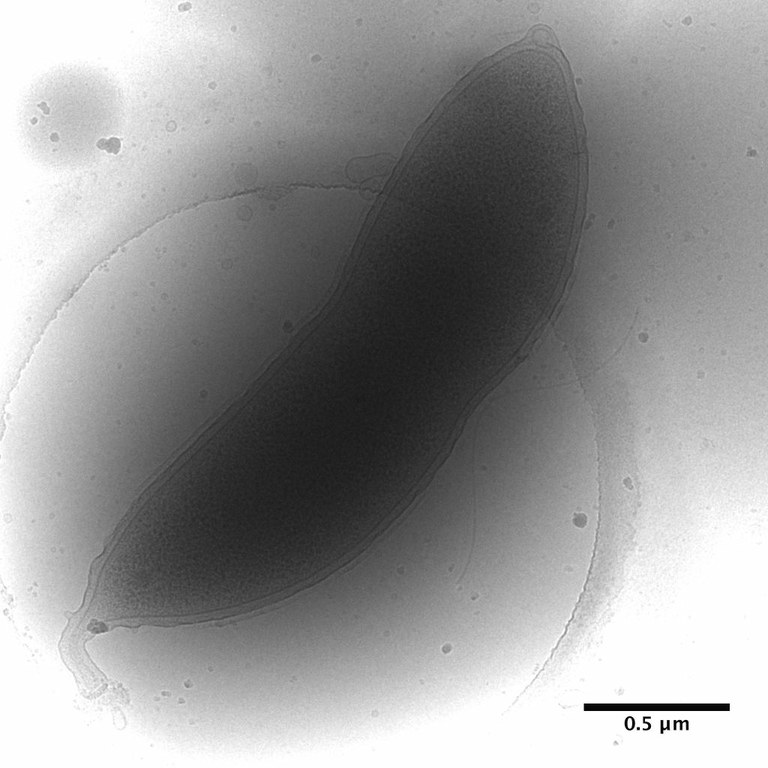
Caulobacter crescentus stalked cell prepared by plunge-freezing in liquid ethane and imaged by cryo-TEM on FEI Tecnai F20. This bacterium is a powerful model for the study of cell-cycle regulation and differentiation as it exists both as an immobilized stalked cell and a motile swarmer cell. It is also particularly useful for prokaryotic structural studies using cryo-electron tomography due to its relatively small size. Image by Dr. Christos Savva, MIC .
January 2010
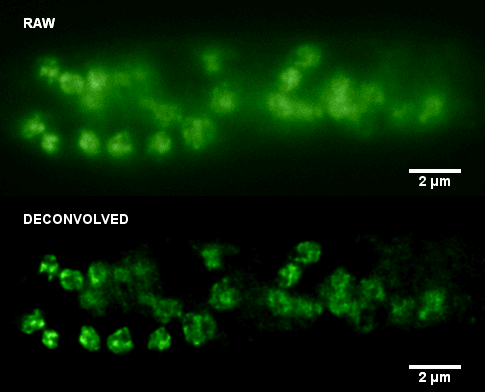
Histone-GFP fusion protein in Neurospora crassa hyphae. Specimen courtesy of Dr. Bell-Pedersen (Department of Biology). A z-stack of GFP fluorescence images was acquired with z-step of 0.2 um, using Zeiss Axiophot microscope equipped with Plan Neofluar 100x/1.3 oil immersion objective and a Coolsnap cf camera. The raw image stack was processed with AutoDeblur X software (Media Cybernetics) using 100 iterations of blind deconvolution algorithm. Maximum intensity projection of the raw and deconvolved stacks is shown. Image data was acquired by Laura Short (Department of Anthropology) during the Spring 2009 Light Microscopy course offered by MIC (BIOL-608, Theory and Applications of Light Microscopy). For additional views of the deconvolved dataset, go to Deconvolution page in the Guides and Tutorials section.
June 2009
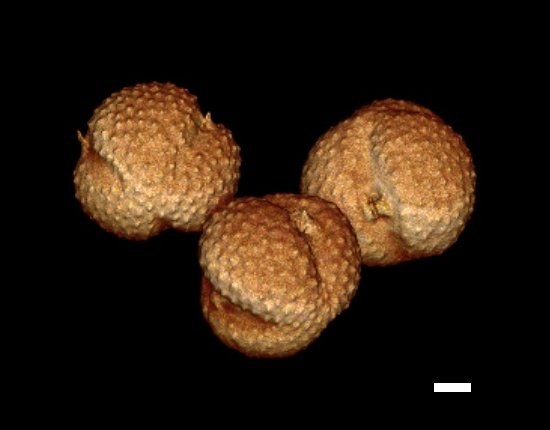
Pollen of Artemisia (Asteraceae). Pollen grains were extracted and embedded in 2,2-thiodiethanol medium and imaged in a photon-counting mode on an Olympus FV1000 confocal microscope equipped with a 100x/1.4 oil immersion objective. The 3D image stack was surface-rendered using Osirix software. Sample preparation and imaging By Stanislav Vitha (MIC), rendering by Amen Zwa (Gannontech Inc.). Scale bar = 10 micrometers.
April 2009
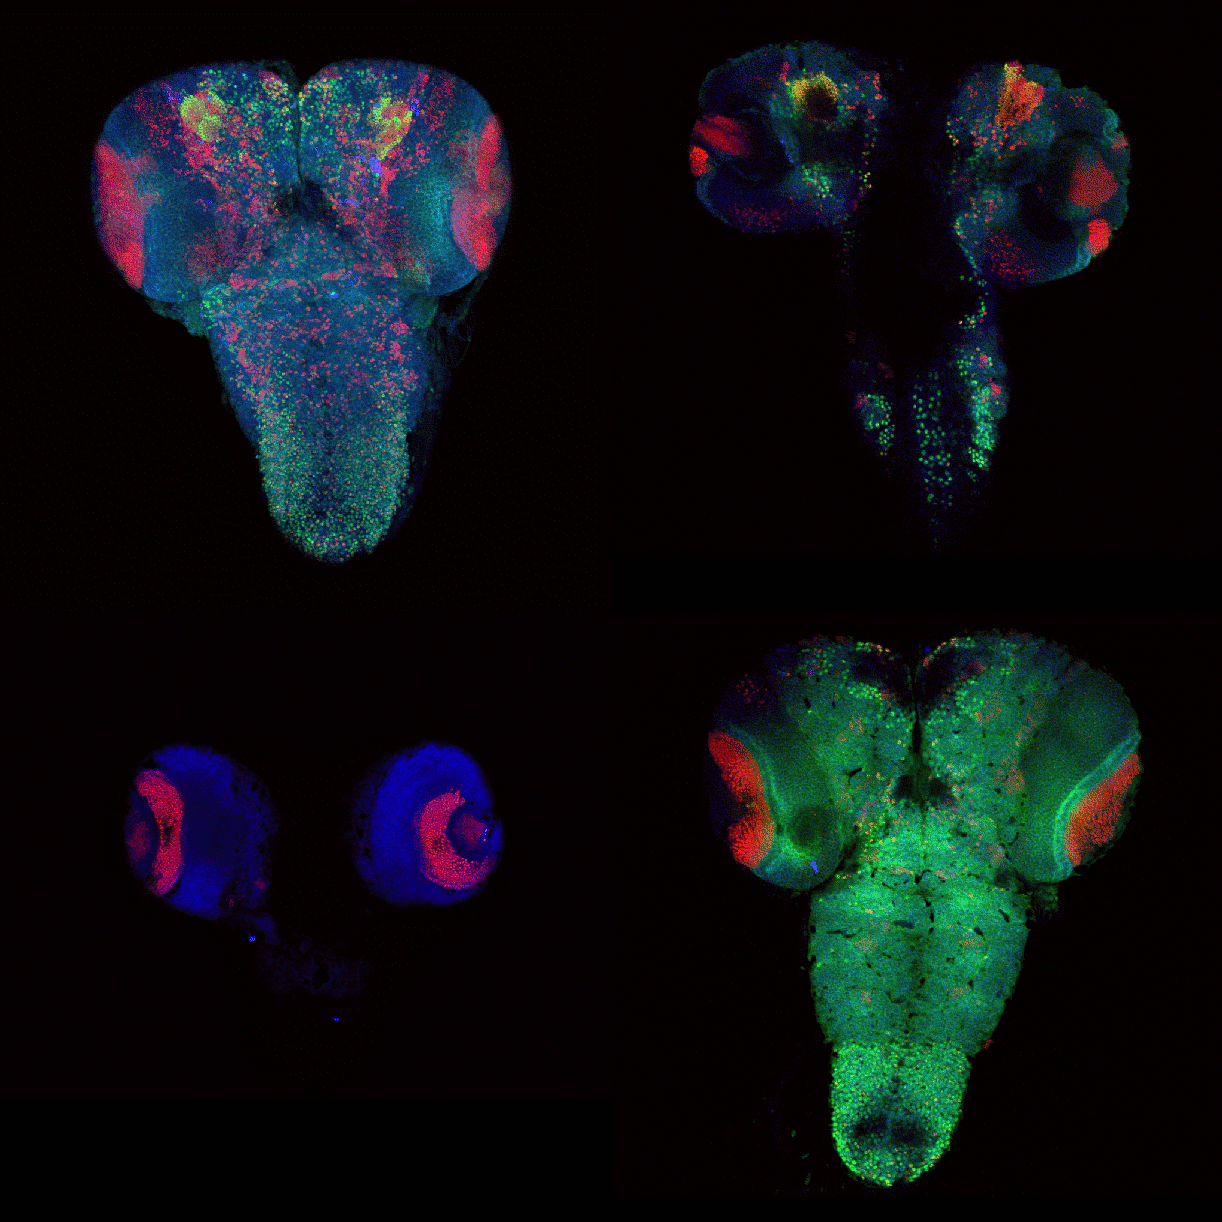
Drosophila brain immunofluorescently labeled to show localization of circadian-clock proteins. Projections of 3D confocal image stacks. Olympus FV1000 confocal microscope, 20x/0.85 oil immersion objective. Images courtesy Jerry Houl (jhoul@bio.tamu.edu), the Hardin Lab, Department of Biology.
February 2009
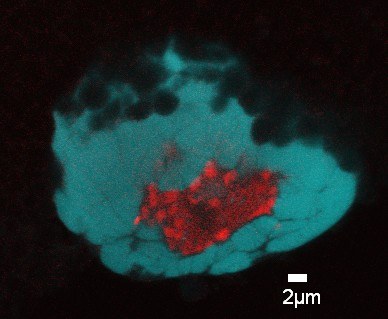
Confocal image of Drosophila melanogaster polytene chromosomes from whole mount salivary glands. Anti-fibrillarin antibody was used to detect the nucleolus (red) and DAPI to stain the DNA. Image by Silvana Paredes (Department of Biology, PI: Keith Maggert).
October 2008
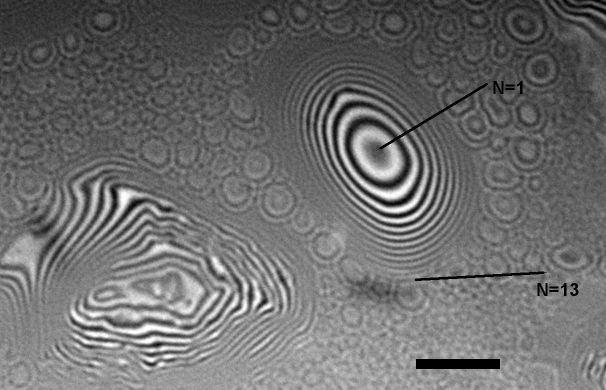
Interferometric micrograph of oil aerosol droplets on a glass slide. The micrograph allows to measure the droplet height by counting the number of interference fringes. Each black fringe corressponds to height step of 1/2 wavelength, in this case ~350 nm. The image was acquired using a Nikon 50x DI Mirau-type interferometric objective mounted on Zeiss Axiophot microscope. Incident light used for illumination was filtered using a 650 nm long-pass filter. Scale bar = 10 micrometers. Image by Stanislav Vitha, MIC.
September 2008
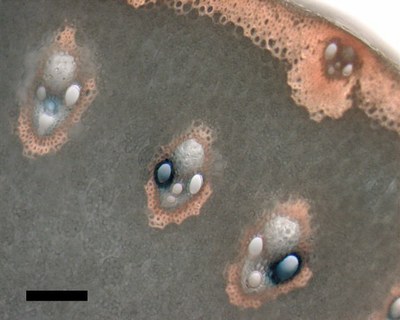
A hand cross-section of transgenic rice stem histochemically stained for beta-glucuronidase (GUS) reporter activity (blue dye indicates sites with GUS activity). Zeiss Axiophot microscope, 10x/0.3 objective, DXM1200 color CCD camera. Scale bar = 100 micrometers. Sample courtesy Dr. Chandra Emani, IDMB, rice biotechnology group. Sectioning and imaging by Stan Vitha, MIC.
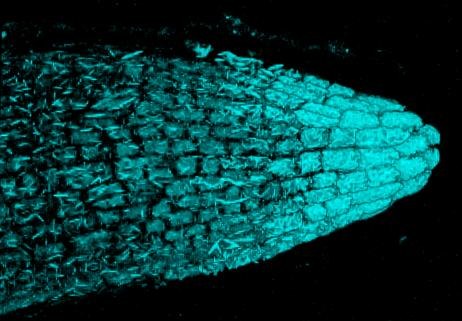
Confocal 3D imaging of beta-glucuronidase (GUS) histochemical staining in Arabidopsis thaliana root tips. The blue reaction product resulting from the indigogenic histochemical reaction exhibits fluorescence near 700 nm and is thus amendable to 3D confocal imaging. The GUS staining is predominantly present in the root cap and rhizodermis. Olympus FV1000 confocal microscope, 60x/1.2 water immersion objective, excitation by 633nm laser. Sample courtesy of Sonia Iriyogen, W. Versaw lab (Biology). Image acquired by Stan Vitha.
July 2008
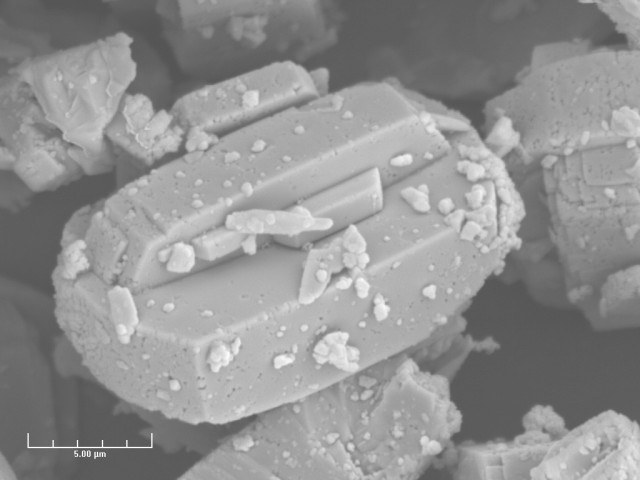
A crystal of zeolite imaged on the JEOL 6400 scanning electron microscope at 5,000x magnification, 15,000 volt accelerating voltage, and 16mm working distance. Image by Dr. Michael Pendelton, MIC.
June 2008
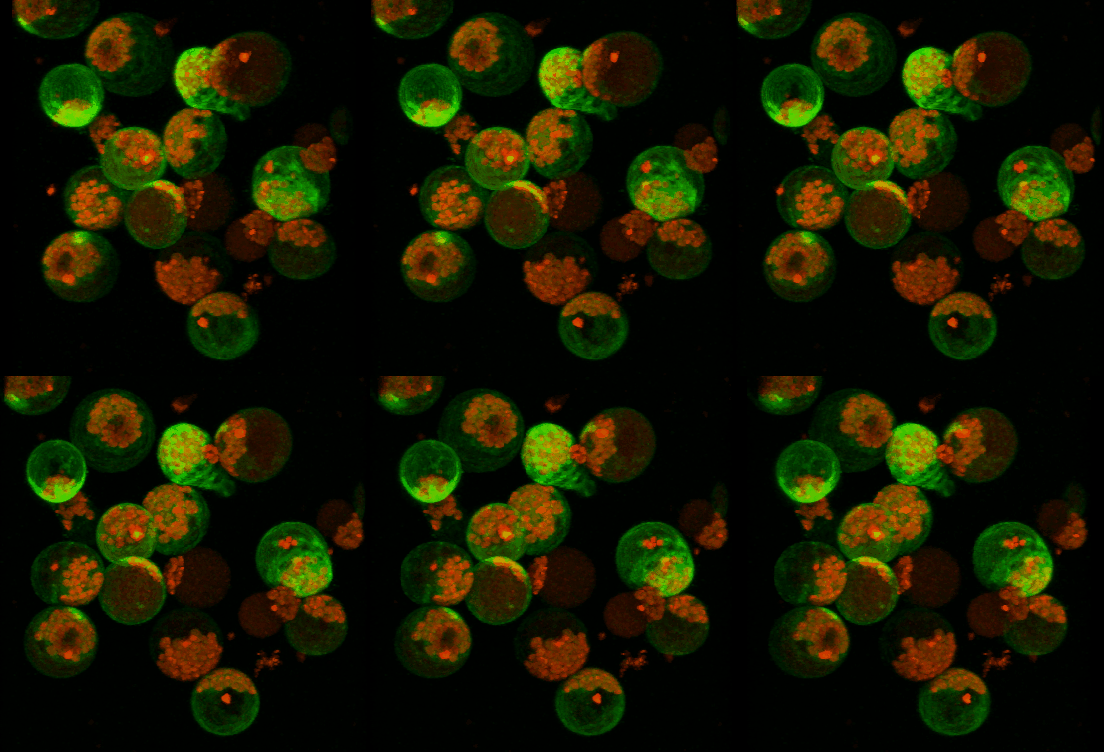
Transient expression of GFP-tagged proteins in tomato protoplasts. The 3D image was acquired using Olympus FV1000 confocal microscope, 60x/1.2 water immersion objective. Green = GFP, red = chloroplasts. Image width is 370 um. Original image data courtesy Maria Julissa Ek-Ramos, PhD.,
Department of Biochemistry and biophysics; http://devarennelab.tamu.edu/
May 2008
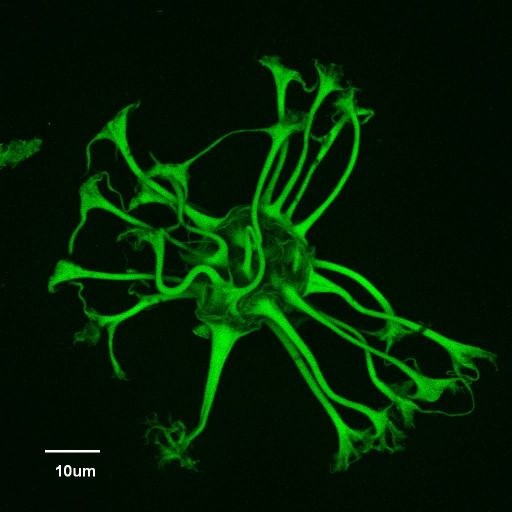
Confocal autofluorescence image of a new genus/species of dinoflagellate cyst discovered from the Eocene (37.6 million years ago) of the Greenland Sea, Ocean Drilling Program Hole 913A (Firth, J.V., 1996: doi:10.2973/odp.proc.sr.151.105.1996). Dinoflagellate cysts are made of dinosporin, a resistant, complex organic compound similar to sporopollenin (which comprises the walls of pollen and spores), that enables cysts to be preserved as microscopic fossils in sediments hundreds of millions of years old. Sample courtesy of John Firth, IODP. Olympus FV1000 confocal microscope, 60x/1.2 water immersion objective.
April 2008
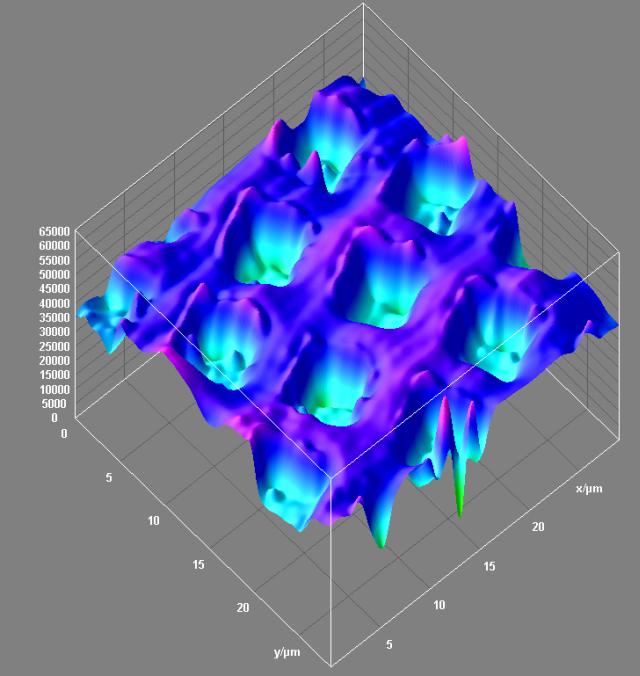
Surface topology of a 3D resolution test specimen. Reflected light confocal data. Olympus FV1000 confocal microscope, 40x/0.6 dry objective. Topological projection of the confocal dataset was visualized with Surface3D plugin in ImageJ software. The square wells in the specimen are 200 nm deep. Image by Stan Vitha.
March 2008
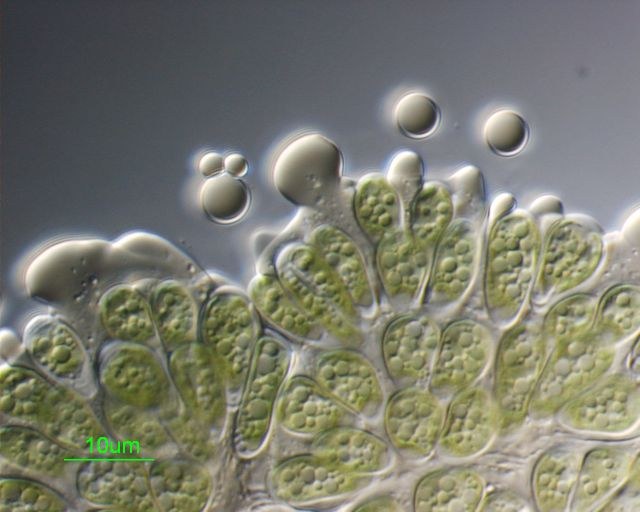
Botryococcus braunii colonial microalgae were crushed, releasing accumulated hydrocarbons stored in the extracellular matrix. Sample courtesy of Taylor Weiss (Dept. of Biochemistry and Biophysics). Differential Interference contrast image was acquired on Zeiss Axiophot microscope, using PlanApo 100x/1.3 oil immersion objective, by Stan Vitha.
